Author Archive for InvestMacro – Page 27

Bulls Beware: A Dark Cloud Is Forming Over Oil Markets

By OilPrice.com

– Bullish sentiment appears to have returned to the stock markets with a vengeance. In a historic rally that has taken even die-hard bulls by surprise, the S&P 500 has managed to claw back all of its 2020 losses, taking just 53 sessions for the index to fully restore the nearly $10T in value it shed in an epic bear market. The oil markets have been nearly as impressive.

After entering negative territory for the first time in history, U.S. WTI prices have briefly touched $40/bbl amid record production cuts and an uptick in global demand. Oil and gas stocks have doubled from their March 23 nadir, marking a sharp reversal from the precipitous drop that wiped out nearly two decades of gains.

There’s no shortage of bottom fishing opportunities in this market, with shares of bankrupt or near-bankrupt shale companies including Whiting Petroleum (NYSE:WLL), Chesapeake Energy (NYSE:CHK), California Resources Corp. (NYSE:CRC) and Valaris Plc (NYSE: VAL) as well as offshore drillers Borr Drilling Ltd (NYSE:BORR), Noble Corp.(NYSE:NE), Seadrill (NYSE:SDRL) and TransOcean (NYSE:RIG) recording triple-digit gains over the past week alone.

But analysts are now saying investors need to pump their brakes.

A cross-section of Wall Street has warned that there’s too much irrational exuberance in the markets, and the oil price rally is not fully supported by fundamentals.

Source: CNN Money

Watching the Crack

According to Warren Patterson, head of commodities strategy at ING, as well as analysts at Goldman Sachs, refining margins, aka crack spreads, across different regions around the globe are still way off their norms, portending continuing weak global demand for distillates.

U.S. crack spreads clocked in at a mere $9/bbl last week, compared to $21 at the same time last year according to Reuters, while crack spreads for European diesel dropped to a record low of $2.90.

Crack spreads are a good proxy for oil demand with falling spreads a sign of weak demand and vice-versa. The badly squeezed margins for refiners is a worrying sign that global demand remains way below normal levels, with the ongoing pick-up in crude prices only serving to worsen the margin contraction for the likes of Valero Energy Corp. (NYSE:VLO), Marathon Petroleum Corp. (NYSE:MPC) and Phillips 66 (NYSE: PSX). WTI and Brent prices have staged a strong rally over the past few weeks after production cuts by OPEC+ and independent producers in the U.S. and elsewhere helped ease a huge supply glut and storage buildup. On Saturday, OPEC and its allies agreed to extend the cuts by an additional month with plans to review progress on a monthly basis. Global oil demand particularly in the giant markets of China and India appears to be recovering at a faster-than-expected clip, with crude imports in China surging 13% in May to a record 11.3 million barrels per day and demand back to 90% of pre-crisis levels. Meanwhile, May sales in India were recorded at ~76% of normal levels while U.S. gasoline demand has seen a 7% uptick during the final week of May to clock in at 75% of pre-COVID-19 levels.

But analysts are now questioning whether the rebound in demand is the result of rising consumption or simply the result of refiners and traders stocking up on cheap crude.

ING’s Patterson and Ehsan Khoman at Japanese bank MUFG say the surge in demand could partly be the result of opportunistic buying by refiners. Consequently, Goldman has predicted that Brent prices will pull back to $35 per barrel in the coming weeks from a recent high of $43.

And they could be right.

According to Bloomberg, the United States’ largest refiner by capacity, Valero Energy, is currently running its two crude units at just 58% of their maximum rate of 424K bbl/day due to low demand and storage filling up. The refinery’s fluid catalytic converter as well as all the hydrotreaters except the distillate hydrotreaters are running at minimum rates while rates on the coker have also been lowered.

In a previous article, we reported that giant oil traders have been storing millions of barrels of crude in the seas with a view to selling when prices improve in the coming months, which could also be driving the surge in demand.

Takeaway

At this juncture, it’s best for investors to adopt an attitude of cautious optimism. On one hand, the bulls argue that OPEC+ has curtailed production too fast, with some oil executives eyeing the seemingly untouchable WTI prices of $70 in the current year.

On the other hand, poor refining margins are telling a different story while oil prices have, worryingly, been strongly pulling back from recent highs on fears that increased production by U.S. shale producers and Libya will offset the OPEC+ cuts.

As many analysts have pointed out, the biggest wild card in this market remains the speed at which demand is going to bounce back in the coming months.

The current evidence though appears to lend support to the bull camp.

Link to original article: https://oilprice.com/Energy/Energy-General/Bulls-Beware-A-Dark-Cloud-Is-Forming-Over-Oil-Markets.html

By Alex Kimani for Oilprice.com


How the Federal Reserve literally makes money

By William J. Luther, Florida Atlantic University 

The Federal Reserve has vowed to provide up to US$2.3 trillion in lending to support households, employers, financial markets and state and local governments struggling as a result of the coronavirus and corresponding stay-at-home orders.

Let that number sink in: $2,300,000,000,000.

I have a Ph.D. in economics, direct the Sound Money Project at the American Institute for Economic Research and write regularly on Federal Reserve policy. And, yet, it is difficult for me to wrap my head around a number that large. If you were to stack 2.3 trillion $1 bills, it would reach over halfway to the Moon.

Put simply, it is a lot of money. Where does it all come from?

Unlike the trillions of dollars the Treasury is spending to save the economy by bailing out companies or beefing up unemployment checks, very little of the Fed’s money actually comes from taxpayers or sales of government bonds. Most of it, in fact, emerges right out of thin air. And that has costs.

Printing green

It is common to hear people say the Fed prints money.

That’s not technically correct. The Bureau of Engraving and Printing, an agency of the U.S. Treasury, does the printing. The Fed, for its part, purchases cash from the bureau at cost and then puts it in circulation.

Although you may have heard some economists talk about the Fed figuratively dropping cash from helicopters, its method of distribution isn’t quite as colorful. Instead, it gives banks cash in exchange for old, worn-out notes or digital balances held by the banks at the Fed. In this way, the Fed can help banks accommodate changes in demand for banknotes, like those in advance of major holidays or after natural disasters.

These exchanges are dollar-for-dollar swaps. The Fed does not typically increase the monetary base – the total amount of currency in circulation and reserves held by banks at the central bank – when it distributes new banknotes.

Magicking green

To put more money into circulation, the Fed typically purchases financial assets – in much the same way that it plans to spend that $2.3 trillion.

To understand how, one must first recognize that the Fed is a bankers’ bank. That is, banks hold deposits at the Fed much like you or I might hold deposits in a checking account at Chase or Bank of America. That means when the Fed purchases a government bond from a bank or makes a loan to a bank, it does not have to – and usually doesn’t – pay with cash. Instead, the Fed just credits the selling or borrowing bank’s account.

The Fed does not print money to buy assets because it does not have to. It can create money with a mere keystroke.

So as the Fed buys Treasuries, mortgage-backed securities, corporate debt and other assets over the coming weeks and months, money will rarely change hands. It will just move from one account to another.

Costs of magical money

While the Fed can create money out of thin air, that does not mean it does so without cost. Indeed, there are two potential costs of creating money that one should keep in mind.

The first results from inflation, which denotes a general increase in prices and, correspondingly, a fall in the purchasing power of money. Money is a highly liquid – easily exchangeable – asset we use to make purchases. When the Fed creates more money than we want to hold on to, we exchange the excess money for less liquid assets, including goods and services. Prices are driven up in the process. When the Fed does this routinely, expected inflation gets built into long-term contracts, like mortgages and employment agreements. Businesses incur costs from having to change prices more frequently, while consumers have to make more frequent trips to the bank or ATM.

The other cost is a consequence of reallocating credit.

Suppose the Fed makes a loan to the “Bank of Fast and Loose Lending.” If the bank wasn’t able to secure alternative funding, this suggests that other private financial institutions deemed its lending practices too risky. In making the loan, the Fed has only created more money. It has not created more real resources that can be bought with money. And so, by giving the Bank of Fast and Loose Lending a lifeline, the Fed enables it to take scarce real resources away from other productive ventures in the economy.

The cost to society is the difference between the value of those real resources as employed by the Bank of Fast and Loose Lending and the value of those real resources as employed in the productive ventures forgone.

Uncharted waters

In recent years, the Fed has shown itself to be quite adept at keeping inflation low, even when making large-scale asset purchases.

The central bank purchased nearly $3.6 trillion worth of assets from September 2008 to January 2015, yet annual inflation averaged roughly 1.5% over the period – well below its 2% target.

I’m less sanguine about the Fed’s ability to keep the costs of reallocating credit low. Congress has traditionally limited the Fed to making loans to banks and other financial market institutions. But now it is tasking the Fed with providing direct assistance to nonbank businesses and municipalities – areas where the Fed lacks experience.

It is difficult to predict how well the Fed will manage its new lending facilities. But its limited experience making loans to small businesses – in the 1930s, for example – does little to alleviate the concerns of myself and others.

Congress gave the Fed the ability to create money from thin air. The Fed should wield this enormous power wisely.

About the Author:

William J. Luther, Assistant Professor of Economics, Florida Atlantic University

This article is republished from The Conversation under a Creative Commons license. Read the original article.


Which Businesses Will Benefit from a Global Recession?

The market is riddled with uncertainties at the moment, but there is no doubt that we are facing – or will soon be facing – a crisis. The economy is no longer growing as rapidly as it used to, and businesses are beginning to struggle to stay operational. Lockdowns and physical distancing are not helping either.

However, some businesses (and industries) thrive in a time of crisis. As a global recession becomes imminent, we are seeing prominent industries holding steady and supporting local economies. Which businesses will benefit from a global recession? Let’s find out, shall we?

Rental and Accommodation

The travel industry is suffering from the negative effects of a global recession, but the same negative effects cannot be seen in the rental property market. Long-term rentals are still in high demand, especially with people trying to adjust their living standards.

Becoming a landlord and offering affordable rentals to customers are steps that you can take to capitalise on this early trend. You can easily pick up an HMO insurance policy and start offering rental units to multiple occupants. In fact, more landlords are getting HMO insurance from top insurance companies to expand their business models and acquire more customers.

Financial Advisory

Financial markets are also suffering badly from a global crisis, but not all financial services are in low demand. As people struggle to make ends meet, maintain a healthy cash flow, and invest wisely, the demand for financial advisory services is also on the rise.

Once again, this is an industry with low entry barrier. If you have the skills, experience, and certifications to become a financial advisor – both for business and personal clients – then now might be a good time to enter the industry.

This is also an industry that grows rapidly as demand soars. Opening a consulting firm that specialises in debt reconstruction or personal financial management, for instance, is a great way to generate new revenue streams in a time of crisis.

Discount Stores

Sticking with the need to save money and be better at personal financial management as a theme, we also have discount stores and online retailers with plenty of special offers benefiting from the global crisis. Discounts are already attractive enough in normal times, so imagine how many more customers discount stores can acquire when everyone is trying to save money.

There are several ways businesses in this industry can offer better deals. They can specialise in certain items and lower their inventory costs. Manufacturers and wholesalers also need to move their merchandises quickly, so they are more likely to offer products at reduced prices; this is where discount stores can really lower their costs.

There are other businesses that will also thrive in a time of crisis. Grocery stores, food delivery services, and home maintenance service providers are among those businesses. The market is changing and a crisis is imminent, so be sure to explore business opportunities that you know can thrive in a time of crisis to generate new revenue streams.

By Taylor Wilman


The Fed’s commitment: Investors will move to top-up portfolios

By George Prior

Investors will move to further top-up their investment portfolios following the U.S. Federal Reserve’s first meeting since last year and since the Covid-19 crisis gripped the global economy, affirms the CEO of one of the world’s largest financial advisory and fintech organizations.

The comments from deVere Group’s Nigel Green follow the Fed’s meeting on Wednesday at which they said they would hold rates the same at near-zero for some time to help boost an economic revival.

Mr Green notes: “It was expected that rates would stay the same and the U.S. central bank’s decision was unanimous on this.

“The focus was on Chairman Jerome Powell’s statement that followed after.

“In a press conference he said that the pandemic “weighs heavily” on the American economy – the largest in the world – and that the Fed would do “whatever we can, and for as long as it takes” to support the recovery and “limit lasting damage” to the economy.

“Against this backdrop, further stimulus can be expected from the Fed – and also perhaps from Congress too – in the near future as the economic revival will be a longer process than many had hoped.”

He continues: “This ‘backstop’ from the Fed slashes the threat of a second market slump even if economic data comes in worse than next quarter.

“It provides something of a ‘floor’ for equities.

“As a result of this, investors will be seeking to further top-up their investment portfolios to get ahead at lower entry points, before the hike in values that would kick-in with another round of stimulus.”

Mr Green’s message, however, comes with a warning too.  “To many, the stock markets have seemed out of step with the bleak economic data recently.

“But it could also be the case that they are giving us clear signals for the current and future shape of the economy, in which there are and will be distinct winners and losers, unlike in other recessions.

“A good fund manager will help investors seek out the opportunities and mitigate potential risks as and when they are presented to generate and build their wealth.”

The deVere CEO concludes: “The Fed believes the economic outlook for the rest of this year will be tough. But it will continue to purchase government-backed debt “at least at the current pace” and the markets believe this will be further increased in order to maintain smooth market function.

“This will support and likely boost asset prices moving forward. Investors will now be eyeing the opportunities before any fresh or enhanced stimulus packages are announced.”

About:

deVere Group is one of the world’s largest independent advisors of specialist global financial solutions to international, local mass affluent, and high-net-worth clients.  It has a network of more than 70 offices across the world, over 80,000 clients and $12bn under advisement.

Japanese Candlesticks Analysis 11.06.2020 (GOLD, NZDUSD, GBPUSD)

Article By RoboForex.com

XAUUSD, “Gold vs US Dollar”

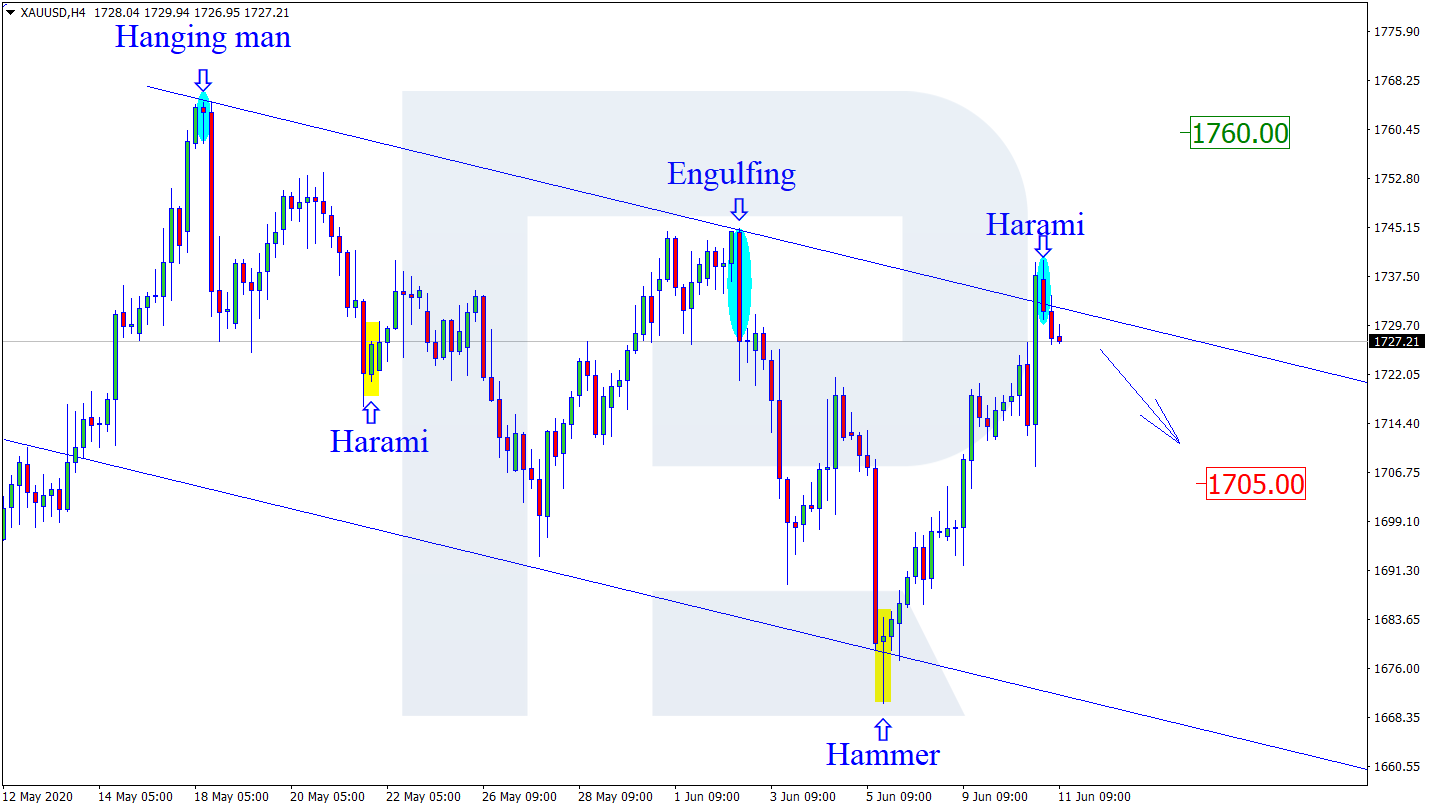
As we can see in the H4 chart, after testing the resistance level and forming a Harami pattern, XAUUSD is reversing. The downside target may be the support level at 1705.00. However, if the price continues growing instead of reversing, it may return to 1760.00.

XAUUSD
Risk Warning: the result of previous trading operations do not guarantee the same results in the future

NZDUSD, “New Zealand vs. US Dollar”

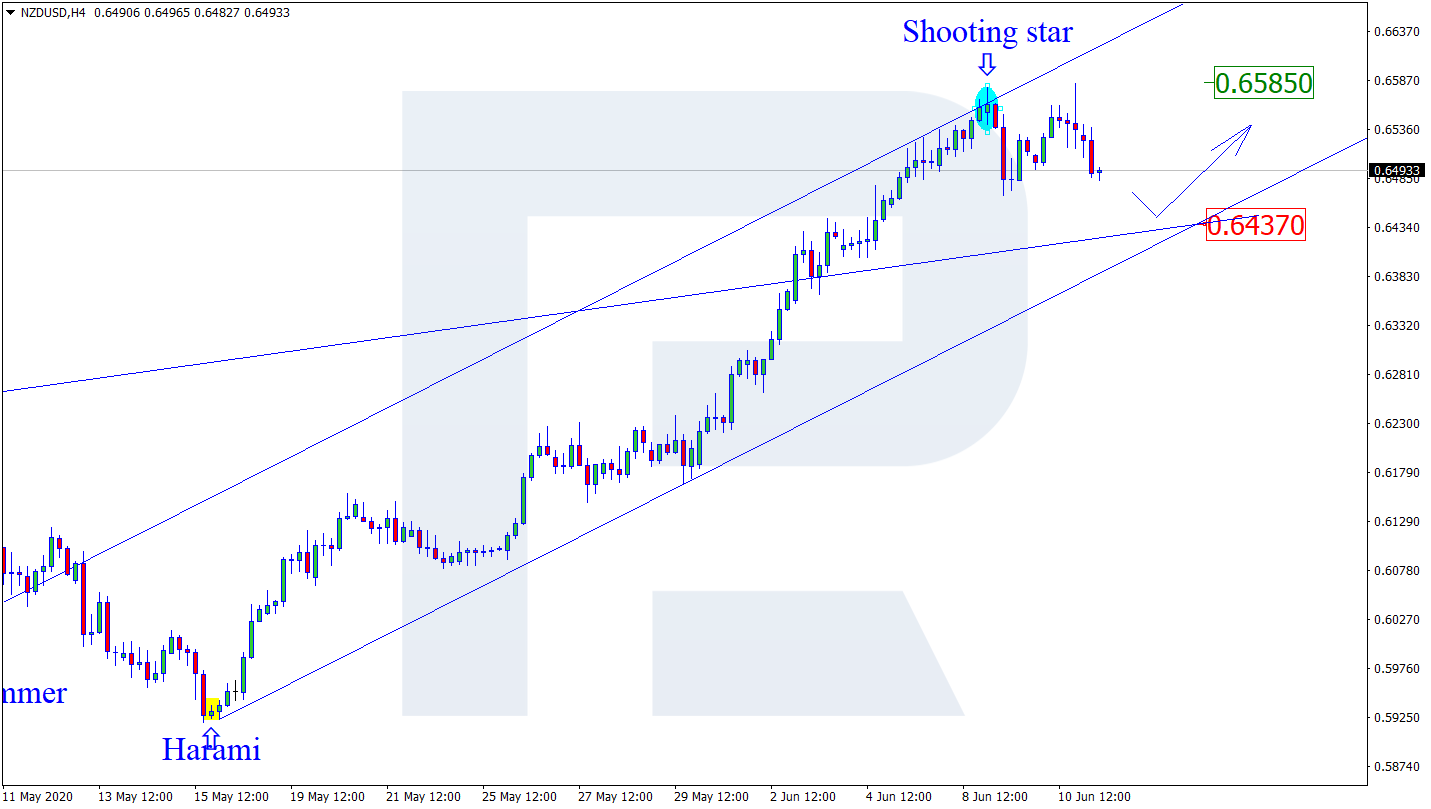
As we can see in the H4 chart, after forming a Shooting Star pattern not far from the resistance level, NZDUSD is still moving upwards. Possibly, the pair may reverse and start a new correction to reach 0.6437. After this pullback, the instrument may resume the ascending tendency. In this case, the upside target may be at 0.6585.

NZDUSD
Risk Warning: the result of previous trading operations do not guarantee the same results in the future

GBPUSD, “Great Britain Pound vs US Dollar”

As we can see in the H4 chart, GBPUSD has formed a Hanging Man reversal pattern while testing the resistance level. At the moment, the pair continues reversing. The correctional target is at 1.2643. After finishing the correction, the instrument may resume the ascending tendency. in this case, the upside target will be at 1.2831.

GBPUSD

Article By RoboForex.com

Attention!
Forecasts presented in this section only reflect the author’s private opinion and should not be considered as guidance for trading. RoboForex LP bears no responsibility for trading results based on trading recommendations described in these analytical reviews.

Ichimoku Cloud Analysis 11.06.2020 (USDCAD, XAUUSD, AUDUSD)

Article By RoboForex.com

USDCAD, “US Dollar vs Canadian Dollar”

USDCAD is trading at 1.3484; the instrument is moving above Ichimoku Cloud, thus indicating an ascending tendency. The markets could indicate that the price may test the cloud’s upside border at 1.3385 and then resume moving upwards to reach 1.3685. Another signal in favor of further uptrend will be a rebound from the descending channel’s upside border. However, the bullish scenario may no longer be valid if the price breaks the cloud’s downside border and fixes below 1.3325. In this case, the pair may continue falling towards 1.3245.

USDCAD
Risk Warning: the result of previous trading operations do not guarantee the same results in the future

XAUUSD, “Gold vs US Dollar”

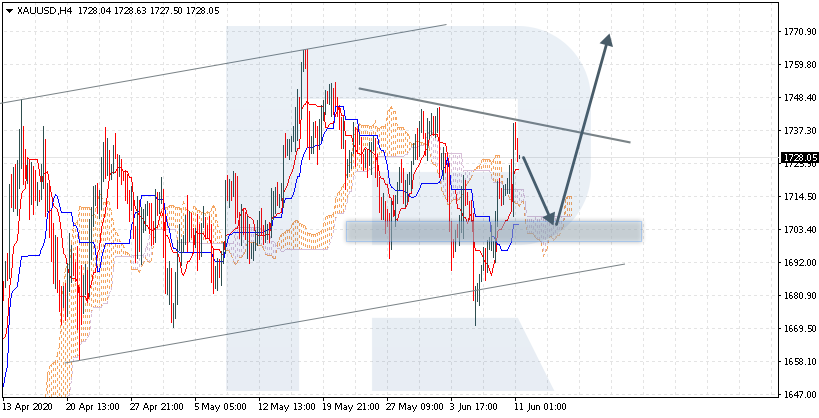
XAUUSD is trading at 1728.00; the instrument is moving above Ichimoku Cloud, thus indicating an ascending tendency. The markets could indicate that the price may test the cloud’s upside border at 1705.00 and then resume moving upwards to reach 1770.00. Another signal in favor of further uptrend will be a rebound from the support level. However, the bullish scenario may no longer be valid if the price breaks the cloud’s downside border and fixes below 1690.00. In this case, the pair may continue falling towards 1645.00. To confirm further growth, the asset must break the neckline of a Head & Shoulders reversal pattern and fix above 1740.00.

XAUUSD
Risk Warning: the result of previous trading operations do not guarantee the same results in the future

AUDUSD, “Australian Dollar vs US Dollar”

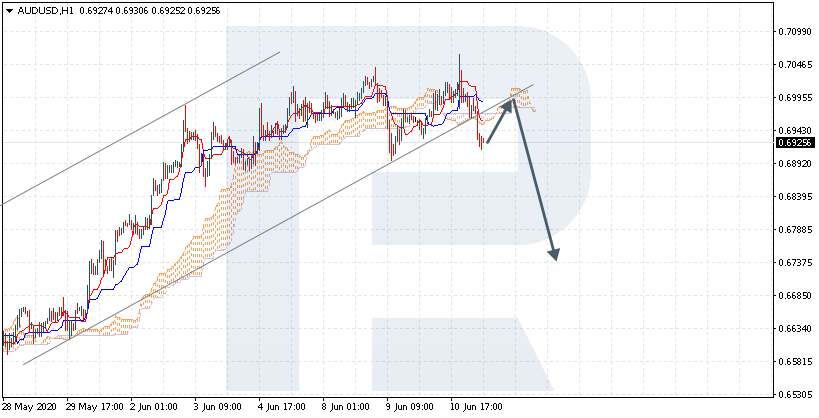
AUDUSD is trading at 0.6925; the instrument is moving below Ichimoku Cloud, thus indicating a descending tendency. The markets could indicate that the price may test the cloud’s downside border at 0.6955 and then resume moving downwards to reach 0.6745. Another signal in favor of further downtrend will be a rebound from the rising channel’s downside border. However, the bearish scenario may no longer be valid if the price breaks the cloud’s upside border and fixes above 0.7045. In this case, the pair may continue growing towards 0.7135.

AUDUSD

Article By RoboForex.com

Attention!
Forecasts presented in this section only reflect the author’s private opinion and should not be considered as guidance for trading. RoboForex LP bears no responsibility for trading results based on trading recommendations described in these analytical reviews.

Investors Assess the Results of the Fed Meeting

by JustForex

During yesterday’s trading session, the US currency fell again relative to a basket of currency majors. The US dollar index (#DX) closed in the negative zone (-0.39%). Yesterday, the Fed meeting was held, during which the regulator left the key interest rate unchanged at 0.00-0.25% per annum. The Fed does not plan to raise interest rates, at least until the end of 2022. The regulator also said that according to its forecasts, the US economy would decline by 6.5% this year, and the unemployment rate would be 9.3% at the end of the year. This value of the Fed worsened investors’ sentiment and forced them to sell stocks and risky currencies.

Meanwhile, the number of cases on COVID-19 in the world has exceeded 7.36 million. The number of people infected with coronavirus in the United States has exceeded 2 million, while doctors urge everyone who took part in recent mass protests against racism to be tested. American protests that began over George Floyd’s death may lead to another outbreak in the coming weeks.

The “black gold” prices have been declining after a prolonged rally. Currently, futures for the WTI crude oil are testing the $38.00 mark per barrel.

Market indicators

Yesterday, there was a variety of trends in the US stock market: #SPY (-0.56%), #DIA (-1.07%), #QQQ (+1.20%).

The 10-year US government bonds yield has been declining. At the moment, the indicator is at the level of 0.70-0.71%.

The news feed on 2020.06.11:
  • – Initial jobless claims at 15:30 (GMT+3:00);
  • – US producer price index at 15:30 (GMT+3:00).

by JustForex

The Analytical Overview of the Main Currency Pairs on 2020.06.11

by JustForex

The EUR/USD currency pair

Technical indicators of the currency pair:
  • Prev Open: 1.13387
  • Open: 1.13746
  • % chg. over the last day: +0.26
  • Day’s range: 1.13241 – 1.13953
  • 52 wk range: 1.0777 – 1.1494

The EUR/USD currency pair continues to consolidate. There is no defined trend. Investors assess the results of the Fed meeting. The regulator does not plan to raise interest rates, at least until the end of 2022. The Central Bank intends to continue to support the national economy, which has been suffered significantly by the COVID-19 pandemic. The Fed forecasts a 6.5% reduction in the country’s GDP this year. At the moment, the key range is 1.1320-1.1400. Today, we expect important economic releases from the US. Positions should be opened from key levels.

The Economic News Feed for 2020.06.11:
  • – Initial jobless claims in the US at 15:30 (GMT+3:00);
  • – US producer price index at 15:30 (GMT+3:00).
EUR/USD

Indicators do not give accurate signals: the price is testing 50 MA.

The MACD histogram is near the 0 mark.

Stochastic Oscillator is in the neutral zone, the %K line has crossed the %D line. There are no signals at the moment.

Trading recommendations
  • Support levels: 1.1320, 1.1250, 1.1195
  • Resistance levels: 1.1400, 1.1450, 1.1500

If the price fixes above the round level of 1.1400, further growth of EUR/USD quotes is expected. The movement is tending to 1.1440-1.1460.

An alternative could be a decrease in the EUR/USD currency pair to 1.1270-1.1240.

The GBP/USD currency pair

Technical indicators of the currency pair:
  • Prev Open: 1.27259
  • Open: 1.27450
  • % chg. over the last day: +0.13
  • Day’s range: 1.26510 – 1.27545
  • 52 wk range: 1.1466 – 1.3516

GBP/USD quotes have become stable after prolonged growth. At the moment, the technical pattern is ambiguous. Financial market participants assess the Fed meeting. The key support and resistance levels are 1.2640 and 1.2730, respectively. Correction of the trading instrument is possible in the near future. We recommend opening positions from key levels.

The news feed on the UK economy is calm.

GBP/USD

Indicators do not give accurate signals: the price has fixed between 50 MA and 100 MA.

The MACD histogram has moved into the negative zone, which indicates the development of the correction movement.

Stochastic Oscillator is near the oversold zone, the %K line has crossed the %D line. There are no signals at the moment.

Trading recommendations
  • Support levels: 1.2640, 1.2585, 1.2500
  • Resistance levels: 1.2730, 1.2800

If the price fixes above 1.2730, GBP/USD purchases should be considered. The movement is tending to 1.2800-1.2830.

An alternative could be a decrease in the GBP/USD currency pair to 1.2580-1.2550.

The USD/CAD currency pair

Technical indicators of the currency pair:
  • Prev Open: 1.34166
  • Open: 1.34115
  • % chg. over the last day: -0.01
  • Day’s range: 1.33973 – 1.34984
  • 52 wk range: 1.2949 – 1.4668

The loonie is being traded in a flat. There is no defined trend. At the moment, USD/CAD quotes are testing the “mirror” resistance of 1.3490. The 1.3425 mark is the nearest support. The USD/CAD currency pair is tending to recover after a prolonged fall. We recommend paying attention to the dynamics of oil quotes. Positions should be opened from key levels.

Today, the publication of important economic releases from Canada is not expected.

USD/CAD

Indicators do not give accurate signals: the price has crossed 100 MA.

The MACD histogram has moved into the positive zone, which indicates the development of bullish sentiment.

Stochastic Oscillator is in the overbought zone, the %K line has crossed the %D line. There are no signals at the moment.

Trading recommendations
  • Support levels: 1.3425, 1.3360, 1.3300
  • Resistance levels: 1.3490, 1.3570

If the price fixes above 1.3490, USD/CAD quotes are expected to correct. The movement is tending to 1.3550-1.3580.

An alternative could be a decrease in the USD/CAD currency pair to 1.3370-1.3340.

The USD/JPY currency pair

Technical indicators of the currency pair:
  • Prev Open: 107.727
  • Open: 107.087
  • % chg. over the last day: -0.58
  • Day’s range: 106.896 – 107.235
  • 52 wk range: 101.19 – 112.41

The USD/JPY currency pair continues to show a steady downtrend. The trading instrument has updated local lows again. USD/JPY quotes have found support at the level of 106.90. The 107.25 mark is the nearest resistance. The further growth of the yen against the greenback is possible. We recommend paying attention to economic reports from the US. Positions should be opened from key levels.

The news feed on Japan’s economy is calm.

USD/JPY

Indicators signal the power of sellers: the price has fixed below 50 MA and 100 MA.

The MACD histogram is in the negative zone, indicating the bearish sentiment.

Stochastic Oscillator is in the neutral zone, the %K line is below the %D line, which gives a signal to sell USD/JPY.

Trading recommendations
  • Support levels: 106.90, 106.50
  • Resistance levels: 107.25, 107.65, 107.90

If the price fixes below 106.90, a further drop in USD/JPY quotes is expected. The movement is tending to 106.50-106.30.

An alternative could be the growth of the USD/JPY currency pair to 107.60-107.80.

by JustForex

Silver: How to Gauge the Crowd’s Mindset

By Elliott Wave International

– Watching out for sentiment extremes helps you avoid getting “caught up with the crowd”

Simply put, a market sentiment extreme is a situation when most everyone has already taken a bullish or bearish position in a financial asset, leaving almost no one left to buy or sell.

Silver provides an excellent case study.

Let’s briefly go back to April 18, 2011, when Elliott Wave International’s U.S. Short Term Update, which provides near-term forecasts for major U.S. financial markets thrice weekly, showed this chart and said:

The 10-day average of Market Vane’s Bullish Consensus has now risen to 93.3%, reflecting a broad consensus among advisors that silver will continue even higher. The Daily Sentiment Index of traders pushed to 97% bulls as of Friday’s close. … Extremes are extremes and have to be recognized as such otherwise one gets caught up with the crowd and fails to extricate themselves at a reversal.

Just a week later, silver hit a high of $49.91 and in less than three weeks, the price had plummeted 35%.

Now, sentiment measures are not always precise timing indicators. Markets can stay overbought or oversold for a long time. Still, extremes can be quite valuable when used along with the Elliott wave model, which was also signaling a turn in silver’s price trend in April 2011.

In the past nine years, silver prices have traded well below their 2011 high, but there have been rallies.

This brings us to 2020.

On May 11, a well-known precious metals website sported this headline:

Silver prices to soar by 40%+, here’s the case …

They proceeded to outline a bullish case that supported their views of even higher silver prices to come.

They may end up being right, however, the May 20 U.S. Short Term Update showed this chart and said:

[Silver]’s rally has coincided with a surge in the Daily Sentiment Index to 91%. Traders are more optimistic toward silver’s future prospects than at any time since the peak at $19.69 on September 4, 2019 (95%). The only other comparable reading was on February 21 of this year, when the DSI rose to 87%. The prior sentiment extremes corresponded with price highs. Silver declined 41% from September 2019 to March 18, at which time the DSI dropped to just 8% bulls. The environment has now come full circle. Today’s new intraday extreme was not confirmed by gold.

Just like back in 2011, today silver’s Elliott wave pattern provides even more insight into what to expect next for the precious metal.

If you’d like to learn more about Elliott wave patterns, Elliott Wave International has made the online version of the Wall Street classic book, Elliott Wave Principle: Key to Market Behavior available for free.

All that’s required to access the wealth of information in the book is a free Club EWI signup. Club EWI is the world’s largest Elliott wave educational community. When you join, you get free access to resources, reports and videos which provide you with Elliott wave insights on investing and trading, the economy and social trends that you will not find anywhere else.

Follow this link for your fast and free Club EWI signup: Elliott Wave Principle: Key to Market Behavior.

This article was syndicated by Elliott Wave International and was originally published under the headline Silver: How to Gauge the Crowd’s Mindset. EWI is the world’s largest market forecasting firm. Its staff of full-time analysts led by Chartered Market Technician Robert Prechter provides 24-hour-a-day market analysis to institutional and private investors around the world.

Financial Sector Under Pressure and What It Means

By TheTechnicalTraders

The Financial sector is unique in that it is an essential component of global economics as well as local economic functions.  Consumers depend on banking services, credit, and all sorts of other financial services in their day-to-day lives.  The Financial sector is one of the components of the US stock market that can suddenly find itself under pricing pressure as an economic crisis event unfolds.  This happens because banks earn a large portion of their income from servicing debt and originating loans.

The recent rally in the Financial sector, over 47% from the March 2020 lows, has reached our proprietary Fibonacci price modeling system’s upside price targets and has also filled a major gap that was created in early March 2020.  Because of these factors, and the current downside price rotation within the Financial Sector, we believe this component of the US stock market could continue to see extended pricing pressure going forward as we learn just how damaging the past 70+ days of the economic shutdown have been for the economy.

We do know that certain consumers have quickly begun to pay off credit card debt.  We believe this is a learned trait from the 2008-09 market crisis where credit card rates skyrocketed as large numbers of consumers began defaulting on their homes and other types of credit.  We also know that delinquencies for autos and other sub-prime credit services have begun to skyrocket higher.  The sub-prime credit market is vastly different than it was in 2008-09.  Recently, Fintech and other new resources have allowed for extended sub-prime lending and leveraging within the US (Source: cnbc.com).

When you combine the sub-prime mortgage, auto, personal loans, personal Fintech margin capabilities, and sub-AAA corporate debt levels, the total amount of at-risk subprime debt must exceed $2 trillion US Dollars.  We believe this source of risk has been greatly underestimated in terms of risk to the Financial Sector over the next 12+ months (Source: zerohedge.com).

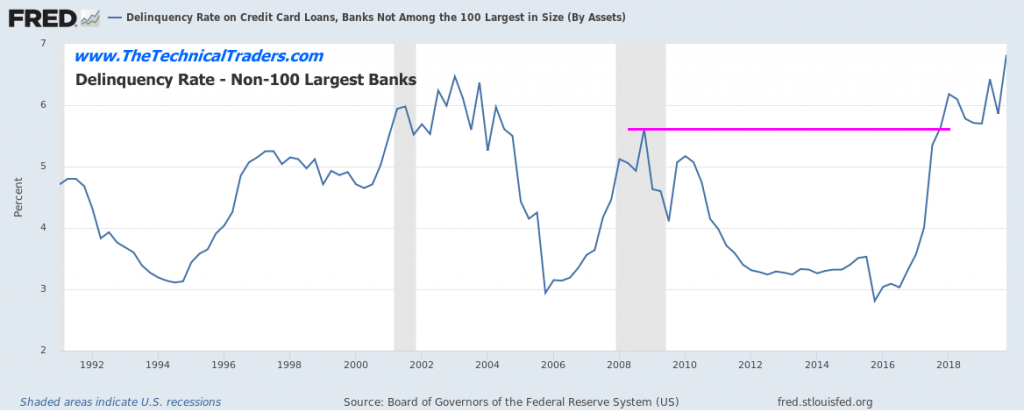
Non-100 Largest Banks Credit Card Delinquency Rates

The current delinquency rate among the non-100 largest US banks for credit cards has already climbed well above the 2008-2010 peak levels.  It appears subprime borrowers are already pushed well beyond their limits in terms of servicing current debt levels.  This suggests a contraction in the credit market will likely take place over the next 24+ months as these at-risk borrowers default at greater rates.  This could transition into the housing market and other sectors of the economy if multiple waves of sub-prime borrowers stress the US financial system because of the COVID-19 shutdown.

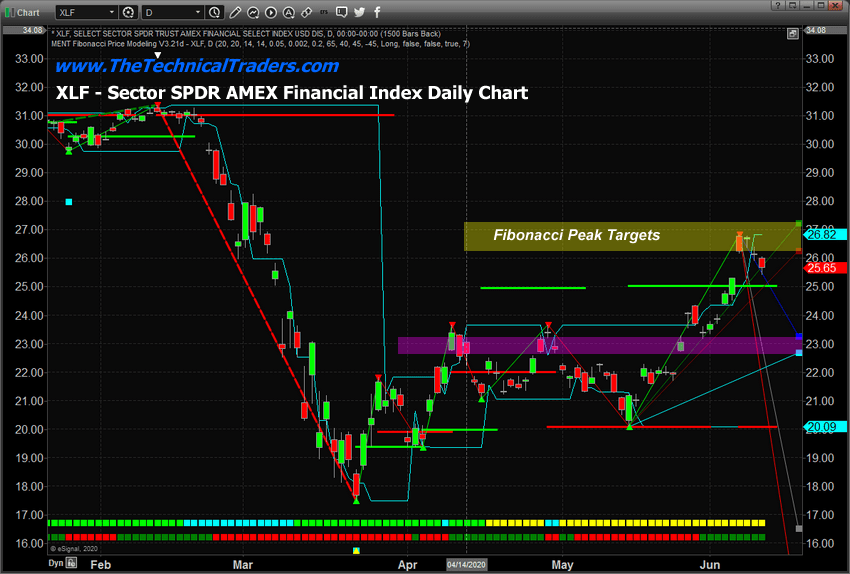
XLF FINANCIAL ETF INDEX DAILY CHART

Our research team believes the peak in the XLF ETF has already set up after the recent 47%+ rally from the March lows.  The $27 price peak sets up directly between our two Fibonacci Daily upside price target (Peak) levels.  We believe this setup is a very strong indication that a move to below $23 may be setting up over the next 30+ days.  The Q2 data may very well push investors to re-evaluate the potential for the Financial sector if delinquencies and at-risk borrowers continue to default in greater numbers.

XLF FINANCIAL ETF INDEX WEEKLY CHART

This XLF Weekly chart highlights the recent rally and the “Gap” that recently filled.  It is our belief that the range between the MAGENTA horizontal lines represents a very clear support/resistance level within this longer-term XLF chart.  We believe that price will have to fall below $25 in order to initiate a deeper downside price move targeting recent low price levels or price will have to move above $27.50 in order to continue to rally.  Currently, our researchers believe the downside potential has a much higher probability of success as we get closer to the end of Q2:2020.

If our research is correct and XLF falls below the $25 price level, we believe it will target at least $22 to $22.50 before finding some support.  If it breaks below the $22 price level, it could fall well below the $20 price level again on weaker expectations.

These types of price swings can be incredible setups for skilled technical traders.  Follow our research and learn how we can help you find and execute better trades.  We recently executed a new swing trade for our members that is already showing great opportunity.  Protect your capital and learn to trade proven technical setups with our dedicated team of researchers and traders.

As a technical analyst and trader since 1997, I have been through a few bull/bear market cycles in stocks and commodities. I believe I have a good pulse on the market and timing key turning points for investing and short-term swing traders. 2020 is an incredible year for traders and investors.  Don’t miss all the incredible trends and trade setups.

Subscribers of my Active ETF Swing Trading Newsletter had our trading accounts close at a new high watermark. We not only exited the equities market as it started to roll over in February, but we profited from the sell-off in a very controlled way with TLT bonds for a 20% gain, and we closed out another winning trade on Friday.

Chris Vermeulen
Chief Market Strategies
Founder of Technical Traders Ltd.

TheTechnicalTraders.com