Author Archive for InvestMacro – Page 26

Fibonacci Retracements Analysis 15.06.2020 (GOLD, USDCHF)

Article By RoboForex.com

XAUUSD, “Gold vs US Dollar”

As we can see in the H4 chart, the divergence made XAUUSD fall and reach 23.6% fibo. The previous rising impulse intended to reach the high at 1764.86 but judging by the structure of an expanding triangle channel, the asset no longer has strengths for further growth. Hence, one can expect a new decline towards 38.2%, 50.0%, and 61.8% fibo at 1645.06, 1607.83, and 1570.90 respectively.

GOLD_H4
Risk Warning: the result of previous trading operations do not guarantee the same results in the future

In the H1 chart, the ascending tendency has tested the local high at 1744.95. If the pair breaks this level, it may continue growing towards the key high at 1764.86 and then the post-correctional extension area between 138.2% and 161.8% fibo at 1773.35 and 1791.05 respectively. At the same time, a “Black Cross” on MACD indicates a possible decline to reach the low at 1670.60.

GOLD_H1
Risk Warning: the result of previous trading operations do not guarantee the same results in the future

USDCHF, “US Dollar vs Swiss Franc”

As we can see in the H4 chart, after reaching 76.0% fibo, USDCHF has rebounded to the upside. At the same time, the rising impulse has tested the resistance at 50.0% fibo (0.9538). In this case, the market is expected to continue trading towards the high at 0.9901. However, one shouldn’t exclude another scenario, according to which the instrument may resume falling to reach the key low at 0.9176.

USDCHF_H4
Risk Warning: the result of previous trading operations do not guarantee the same results in the future

The H1 chart shows a more detailed structure of the current ascending tendency. One can see that the convergence made the pair start a new growth, which has already reached 38.2% fibo. The next rising impulse will be heading towards 50.0%, 61.8%, and 76.0% fibo at 0.9580, 0.9628 and 0.9686 respectively. The local support is the low at 0.9376.

USDCHF_H1

Article By RoboForex.com

Attention!
Forecasts presented in this section only reflect the author’s private opinion and should not be considered as guidance for trading. RoboForex LP bears no responsibility for trading results based on trading recommendations described in these analytical reviews.

The US Currency Is in the Positive Zone

by JustForex

Since the end of last week, the US dollar has been growing against a basket of currency majors. The US dollar index (#DX) closed in the positive zone (+0.59%). Demand for risky assets has significantly weakened amid investors’ concerns about a possible second wave of coronavirus. In the United States, the incidence rate for COVID-19 has reached 2 million. Financial market participants are worried that the second wave of the virus could do even more harm to the global economy.

The British authorities officially announced that they would not seek an extension of the Brexit transition period and would complete the country’s exit from the EU on January 1, 2021. On January 1, 2021, the British authorities will regain control of the country, as well as political and economic independence. British Prime Minister Boris Johnson has repeatedly stated that he did not intend to extend negotiations on further relations between the EU and the UK, even despite the coronavirus, which complicates many processes and the country’s economic situation.

The “black gold” prices have continued to decline. Currently, futures for the WTI crude oil are testing the $35.65 mark per barrel.

Market indicators

On Friday, there was the bullish sentiment in the US stock market: #SPY (+1.20%), #DIA (+1.87%), #QQQ (+0.79%).

The 10-year US government bonds yield has been growing. At the moment, the indicator is at the level of 0.67-0.68%.

The news feed on 2020.06.15:
  • Today, the publication of important economic data is not expected. We recommend paying attention to the speeches by FOMC representatives.

by JustForex

The Analytical Overview of the Main Currency Pairs on 2020.06.15

by JustForex

The EUR/USD currency pair

Technical indicators of the currency pair:
  • Prev Open: 1.12912
  • Open: 1.12342
  • % chg. over the last day: -0.38
  • Day’s range: 1.12263 – 1.12684
  • 52 wk range: 1.0777 – 1.1494

Sales prevail on the EUR/USD currency pair. The trading instrument has updated local lows. Demand for risky assets continues to weaken. Financial market participants are concerned about the second outbreak of coronavirus. Investors expect a speech by the Fed Chairman, which will be held tomorrow. Jerome Powell should report for the half year on the monetary policy of the Central Bank and announce economic forecasts. Currently, EUR/USD quotes are consolidating in the range of 1.1220-1.1275. The single currency has a potential for further decline. Positions should be opened from key levels.

The Economic News Feed for 2020.06.15:
  • – Eurozone trade balance at 12:00 (GMT+3:00).

We also recommend paying attention to the speeches of FOMC representatives.

EUR/USD

Indicators do not give accurate signals: 50 MA has crossed 100 MA.

The MACD histogram is in the negative zone, but above the signal line, which gives a weak signal to sell EUR/USD.

Stochastic Oscillator is in the neutral zone, the %K line has crossed the %D line. There are no signals at the moment.

Trading recommendations
  • Support levels: 1.1220, 1.1190, 1.1115
  • Resistance levels: 1.1275, 1.1325, 1.1380

If the price fixes below the level of 1.1220, a further fall in EUR/USD quotes is expected. The movement is tending to 1.1180-1.1150.

An alternative could be the growth of the EUR/USD currency pair to 1.1320-1.1350.

The GBP/USD currency pair

Technical indicators of the currency pair:
  • Prev Open: 1.26000
  • Open: 1.25091
  • % chg. over the last day: -0.48
  • Day’s range: 1.24541 – 1.25480
  • 52 wk range: 1.1466 – 1.3516

There is the bearish sentiment on the GBP/USD currency pair. The British pound has updated local lows. Currently, GBP/USD quotes are consolidating. The key range is 1.2460-1.2550. The demand for risky assets is still low. The British pound is under pressure due to a weak report on UK GDP. Investors expect a meeting of the Bank of England, which will be held later this week. A further decline in the trading instrument is possible. We recommend opening positions from key levels.

GBP/USD

Indicators signal the power of sellers: the price has fixed below 50 MA and 100 MA.

The MACD histogram is in the negative zone, but above the signal line, which gives a weak signal to sell GBP/USD.

Stochastic Oscillator is in the neutral zone, the %K line has crossed the %D line. There are no signals at the moment.

Trading recommendations
  • Support levels: 1.2460, 1.2400
  • Resistance levels: 1.2550, 1.26150, 1.2650

If the price fixes below 1.2460, a further fall in GBP/USD quotes is expected. The movement is tending to the round level of 1.2400.

An alternative could be the growth of the GBP/USD currency pair to 1.2600-1.2640.

The USD/CAD currency pair

Technical indicators of the currency pair:
  • Prev Open: 1.36242
  • Open: 1.36012
  • % chg. over the last day: -0.30
  • Day’s range: 1.35993 – 1.36860
  • 52 wk range: 1.2949 – 1.4668

USD/CAD quotes have become stable after a significant increase at the end of last week. The loonie is currently consolidating. The technical pattern is ambiguous. The key range is 1.3600-1.3680. Financial market participants expect additional drivers. We recommend paying attention to the dynamics of oil quotes. Positions should be opened from key levels.

Today, the publication of important economic releases from Canada is not expected.

USD/CAD

Indicators signal the power of buyers: the price has fixed above 50 MA and 100 MA.

The MACD histogram is in the positive zone, indicating the bullish sentiment.

Stochastic Oscillator is in the overbought zone, the %K line has crossed the %D line. There are no signals at the moment.

Trading recommendations
  • Support levels: 1.3600, 1.3530, 1.3480
  • Resistance levels: 1.3680, 1.3750

If the price fixes above 1.3680, further growth of USD/CAD quotes is expected. The movement is tending to 1.3740-1.3760.

An alternative could be a decrease in the USD/CAD currency pair to 1.3550-1.3520.

The USD/JPY currency pair

Technical indicators of the currency pair:
  • Prev Open: 106.880
  • Open: 107.316
  • % chg. over the last day: +0.46
  • Day’s range: 106.998 – 107.566
  • 52 wk range: 101.19 – 112.41

The USD/JPY currency pair has become stable. The trading instrument is currently consolidating. There is no defined trend. The trading instrument is testing local support and resistance levels: 107.00 and 107.55, respectively. The technical pattern signals a possible correction of USD/JPY quotes. We recommend paying attention to the dynamics of US government bonds yield. Positions should be opened from key levels.

The news feed on Japan’s economy is calm.

USD/JPY

Indicators do not give accurate signals: the price has fixed between 50 MA and 100 MA.

The MACD histogram is near the 0 mark.

Stochastic Oscillator is in the neutral zone, the %K line has crossed the %D line. There are no signals at the moment.

Trading recommendations
  • Support levels: 107.00, 106.60
  • Resistance levels: 107.55, 107.90, 108.25

If the price fixes above 107.55, further growth of USD/JPY quotes is expected. The movement is tending to 107.90-108.20.

An alternative could be a decrease in the USD/JPY currency pair to 106.60-106.40.

by JustForex

DAX30 bears in charge of the price action again, 12,000 in focus

By Admiral Markets

Source: Economic Events June 15, 2020 – Admiral Markets’ Forex Calendar

Up to the Fed rate decision on Wednesday, the DAX had been losing some of the bullish momentum it has had since it took off in Mid-May, where it gained more than 25% from its lows in less than a month, until it found resistance around 12,900 points.

On Thursday, the tide turned and the German index dropped more than 5%, back below 12,000 points, and struggled to close the week of trading above this psychological relevant threshold.

What became clear in our opinion is, that despite Wednesday’s ‘Equity-friendly’ rhetoric from the Fed (which can be interpreted as ‘ultra-dovish’ as it keeps interest rates at 0% at least till the end of 2022, continuing to buy USTs and MBS at least at the current pace of ~80b USD/month), market participants expect more, with much of the Fed dovishness was already priced into the market.

That said, even with the German index making back some of its losses from Thursday on Friday, the risk of another sharper drop in the days to come seems quite high with the risk-reward-ratio becoming more attractive on the Short-side.

A stronger zone of resistance can be found around 12,300/350 points, the former trend-support.

A drop below 11,800 respectively the pre-weekly lows around 11,700 points can realistically trigger a next wave lower and activates the region around 11,450/500 as a potential target on the downside:
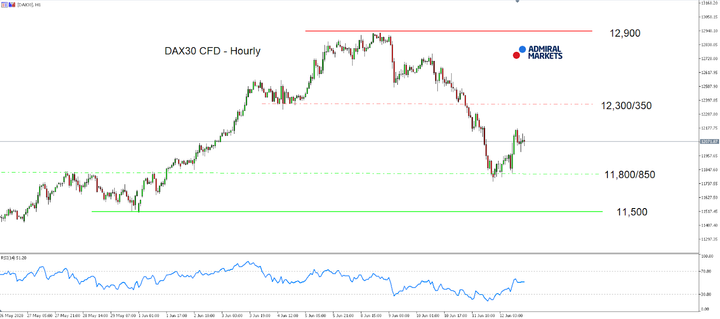
Source: Admiral Markets MT5 with MT5-SE Add-on DAX30 CFD Hourly chart (between May 26, 2020, to June 12, 2020). Accessed: June 12, 2020, at 10:00pm GMT
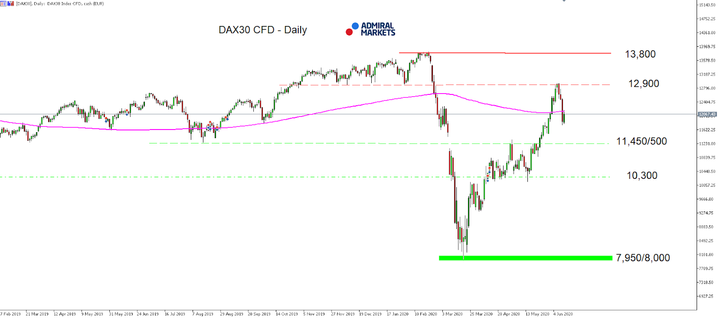
Source: Admiral Markets MT5 with MT5-SE Add-on DAX30 CFD Daily chart (between February 27, 2019, to June 12, 2020). Accessed: June 12, 2020, at 10:00pm GMT – Please note: Past performance is not a reliable indicator of future results, or future performance.

In 2015, the value of the DAX30 CFD increased by 9.56%, in 2016, it increased by 6.87%, in 2017, it increased by 12.51%, in 2018, it fell by 18.26%, in 2019, it increased by 26.44% meaning that after five years, it was up by 34.2%.

Discover the world’s #1 multi-asset platform

Admiral Markets offers professional traders the ability to trade with a custom, upgraded version of MetaTrader 5, allowing you to experience trading at a significantly higher, more rewarding level. Experience benefits such as the addition of the Market Heat Map, so you can compare various currency pairs to see which ones might be lucrative investments, access real-time trading data, and so much more. Click the banner below to start your FREE download of MT5 Supreme Edition!

Download MetaTrader 5 and begin trading today!

Disclaimer: The given data provides additional information regarding all analysis, estimates, prognosis, forecasts or other similar assessments or information (hereinafter “Analysis”) published on the website of Admiral Markets. Before making any investment decisions please pay close attention to the following:

  1. This is a marketing communication. The analysis is published for informative purposes only and are in no way to be construed as investment advice or recommendation. It has not been prepared in accordance with legal requirements designed to promote the independence of investment research, and that it is not subject to any prohibition on dealing ahead of the dissemination of investment research.
  2. Any investment decision is made by each client alone whereas Admiral Markets shall not be responsible for any loss or damage arising from any such decision, whether or not based on the Analysis.
  3. Each of the Analysis is prepared by an independent analyst (Jens Klatt, Professional Trader and Analyst, hereinafter “Author”) based on the Author’s personal estimations.
  4. To ensure that the interests of the clients would be protected and objectivity of the Analysis would not be damaged Admiral Markets has established relevant internal procedures for prevention and management of conflicts of interest.
  5. Whilst every reasonable effort is taken to ensure that all sources of the Analysis are reliable and that all information is presented, as much as possible, in an understandable, timely, precise and complete manner, Admiral Markets does not guarantee the accuracy or completeness of any information contained within the Analysis. The presented figures refer that refer to any past performance is not a reliable indicator of future results.
  6. The contents of the Analysis should not be construed as an express or implied promise, guarantee or implication by Admiral Markets that the client shall profit from the strategies therein or that losses in connection therewith may or shall be limited.
  7. Any kind of previous or modeled performance of financial instruments indicated within the Publication should not be construed as an express or implied promise, guarantee or implication by Admiral Markets for any future performance. The value of the financial instrument may both increase and decrease and the preservation of the asset value is not guaranteed.
  8. The projections included in the Analysis may be subject to additional fees, taxes or other charges, depending on the subject of the Publication. The price list applicable to the services provided by Admiral Markets is publicly available from the website of Admiral Markets.

Leveraged products (including contracts for difference) are speculative in nature and may result in losses or profit. Before you start trading, you should make sure that you understand all the risks

By Admiral Markets

The different types of Forex Charts and How Do they work

The Forex chart is an image that reflects a change in price. Without charts, you won’t have any clue about the market.

Analysis of market data on charts is also called technical analysis in forex.

How do Forex charts work?

Charts are plotted in a rectangular system of two coordinates. Time is plotted on the horizontal x-axis, while price, volume, and tick chart are shown on the vertical y-axis.

The period corresponding to a unit interval on the x-axis or depends on the degree of compression of market data. On the tick chart, each change in the exchange rate is displayed. This is the smallest timeframe.

Tick ​​information about transactions is not always available and is not necessary. Therefore, generalized and concise price history for a certain period is most often used.

For any period (minutes, hours, days, weeks, etc.) there are four main values ​​of the exchange rate:

  • Opening price (Open, O) – the first price of the period
  • Maximum price (High, H) – the highest price for the period
  • Minimum price (Low, L) – the lowest price for the period
  • Close Price (Close, C) – the last price of the period

One price value of a period or all four at a time can be plotted on a chart.

At each point, the exchange rate on the Forex market is presented in the form of a bid/ask quote. The chart can be built on both of these prices and on their average value ([Bid + Ask] /2.) If the chart is based on the bid price, then the ask price is not displayed, and vice versa.

Modern trading platforms allow you to receive market data in real-time and build different graphs on their basis.

Types of Forex charts

The main types of Forex charts are:

Line chart

A line chart is a straightforward method for displaying price movements. It displays information on a single line using a series of dots.

Line chart

Bar chart

The bar chart provides instant information on price movements for a specified period. Bar charts are often used to track market volatility; the longer the bars, the greater the market volatility. It offers more information than a line chart.

Bar chart

Japanese Candlesticks

Japanese candlestick charts are very useful graphs that describe the movement of the price of any trading instrument. They can provide helpful information, such as market sentiment or possible trend changes using specific patterns.

Candlestick charts provide information on four key elements in the period under review:

  • Open price
  • Close price
  • High price
  • Low price

In the forex market, candlestick charts are often used for technical analysis of currency pairs.

Here, we should mention that Japanese candlesticks have multiple patterns like doji, morning star, three crows, hanging man and hammer, and many others.

Candlestick chart

Where to find Forex charts?

The fastest and easiest way to get free Forex charts is to download a trading platform (MT4, MT5) or log in to webtrader. Tools for technical analysis and forecasts will also be available to you.

Other types of charts are Hieken Ashi, Renko, point & figure, HLC, hollow candles, etc.

Source of content and images: Some of the facts and images have been picked from FXCC’s article How to read Forex charts and Wikipedia Chart pattern.


The Analytical Overview of the Main Currency Pairs on 2020.06.12

by JustForex

The EUR/USD currency pair

Technical indicators of the currency pair:
  • Prev Open: 1.13746
  • Open: 1.12912
  • % chg. over the last day: -0.63
  • Day’s range: 1.12766 – 1.13161
  • 52 wk range: 1.0777 – 1.1494

EUR/USD quotes have been declining. The trading instrument has updated local lows. The demand for risky assets has weakened significantly. Financial market participants are concerned about the second wave of COVID-19 outbreak. The United States has reported more than 2 million coronavirus cases as of June 12, as well as a re-wave of infection in the most populous states. Currently, the single currency is consolidating in the range of 1.1275-1.1320. EUR/USD quotes have the potential for further correction. Positions should be opened from key levels.

The Economic News Feed for 2020.06.12:
  • – Eurozone industrial production at 12:00 (GMT+3:00).
EUR/USD

Indicators do not give accurate signals: the price has fixed between 50 MA and 100 MA.

The MACD histogram is in the negative zone, but above the signal line, which gives a weak signal to sell EUR/USD.

Stochastic Oscillator is in the overbought zone, the %K line has crossed the %D line. There are no signals at the moment.

Trading recommendations
  • Support levels: 1.1275, 1.1240, 1.1190
  • Resistance levels: 1.1320, 1.1380, 1.1420

If the price fixes below the level of 1.1275, a further fall in EUR/USD quotes is expected. The movement is tending to 1.1240-1.1200.

An alternative could be the growth of the EUR/USD currency pair to 1.1370-1.1400.

The GBP/USD currency pair

Technical indicators of the currency pair:
  • Prev Open: 1.27450
  • Open: 1.26000
  • % chg. over the last day: -1.37
  • Day’s range: 1.25452 – 1.26453
  • 52 wk range: 1.1466 – 1.3516

The GBP/USD currency pair has been declining. The British pound has updated local lows. At the moment, the key range is 1.2550-1.2640. The demand for risky assets is still low. The British pound is under pressure due to pessimistic economic releases. A further drop in GBP/USD quotes is possible. We recommend opening positions from key levels.

GBP/USD

Indicators do not give accurate signals: the price has crossed 100 MA.

The MACD histogram is in the negative zone, but above the signal line, which gives a weak signal to sell GBP/USD.

Stochastic Oscillator is near the overbought zone, the %K line has crossed the %D line. There are no signals at the moment.

Trading recommendations
  • Support levels: 1.2550, 1.2500, 1.2425
  • Resistance levels: 1.2640, 1.2730, 1.2800

If the price fixes below 1.2550, GBP/USD sales should be considered. The movement is tending to 1.2500-1.2460.

An alternative could be the growth of the GBP/USD currency pair to 1.2700-1.2750.

The USD/CAD currency pair

Technical indicators of the currency pair:
  • Prev Open: 1.34115
  • Open: 1.36242
  • % chg. over the last day: +1.59
  • Day’s range: 1.35407 – 1.36664
  • 52 wk range: 1.2949 – 1.4668

During yesterday’s trading session, aggressive purchases of USD/CAD were observed. Quotes growth has exceeded 220 points. The trading instrument has set new local highs. At the moment, the loonie is stable and consolidating in the range of 1.3530-1.3600. We do not exclude the further growth of USD/CAD quotes. We recommend paying attention to the dynamics of oil quotes. Positions should be opened from key levels.

Today, the publication of important economic releases from Canada is not expected.

USD/CAD

Indicators signal the power of buyers: the price has fixed above 50 MA and 100 MA.

The MACD histogram is in the positive zone, but below the signal line, which gives a weak signal to buy USD/CAD.

Stochastic Oscillator is in the oversold zone, the %K line has crossed the %D line. There are no signals at the moment.

Trading recommendations
  • Support levels: 1.3530, 1.3480, 1.3430
  • Resistance levels: 1.3600, 1.3665

If the price consolidates above 1.3600, further growth of USD/CAD quotes is expected. The movement is tending to 1.3660-1.3700.

An alternative could be a decrease in the USD/CAD currency pair to 1.3480-1.3430.

The USD/JPY currency pair

Technical indicators of the currency pair:
  • Prev Open: 107.087
  • Open: 106.880
  • % chg. over the last day: -0.23
  • Day’s range: 106.585 – 107.529
  • 52 wk range: 101.19 – 112.41

The USD/JPY currency pair has started recovering after a prolonged fall. The trading instrument has updated local highs. At the moment, the key support and resistance levels are 107.10 and 107.60, respectively. The technical pattern signals a further increase in USD/JPY quotes. We recommend paying attention to the dynamics of US government bonds yield. Positions should be opened from key levels.

During the Asian trading session, weak data on industrial production were published in Japan.

USD/JPY

Indicators do not give accurate signals: the price has fixed between 50 MA and 100 MA.

The MACD histogram has started growing, which indicates the development of bullish sentiment.

Stochastic Oscillator is in the overbought zone, the %K line has crossed the %D line. There are no signals at the moment.

Trading recommendations
  • Support levels: 107.10, 106.60
  • Resistance levels: 107.60, 107.90, 108.25

If the price fixes above 107.60, further growth of USD/JPY quotes is expected. The movement is tending to 108.00-108.20.

An alternative could be a decrease in the USD/JPY currency pair to 106.70-106.40.

by JustForex

Ichimoku Cloud Analysis 12.06.2020 (BTCUSD, USDCAD, NZDUSD)

Article By RoboForex.com

BTCUSD, “Bitcoin vs US Dollar”

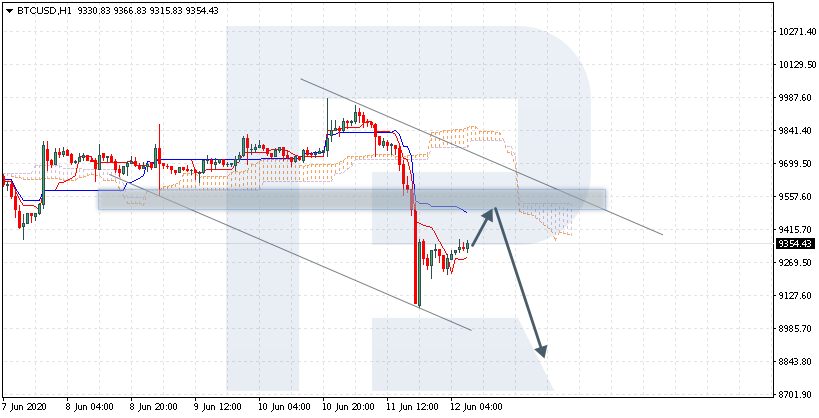
BTCUSD is trading at 9354.00; the instrument is moving below Ichimoku Cloud, thus indicating a descending tendency. The markets could indicate that the price may test Tenkan-Sen and Kijun-Sen at 9475.00 and then resume moving downwards to reach 8845.00. Another signal in favor of further downtrend will be a rebound from the resistance level. However, the bearish scenario may no longer be valid if the price breaks the cloud’s upside border and fixes above 9805.00. In this case, the pair may continue growing towards 10255.00.

BTCUSD
Risk Warning: the result of previous trading operations do not guarantee the same results in the future

USDCAD, “US Dollar vs Canadian Dollar”

USDCAD is trading at 1.3600; the instrument is moving above Ichimoku Cloud, thus indicating an ascending tendency. The markets could indicate that the price may test Tenkan-Sen and Kijun-Sen at 1.3545 and then resume moving upwards to reach 1.3755. Another signal in favor of further uptrend will be a rebound from the rising channel’s downside border. However, the bullish scenario may no longer be valid if the price breaks the cloud’s downside border and fixes below 1.3385. In this case, the pair may continue falling towards 1.3295.

USDCAD
Risk Warning: the result of previous trading operations do not guarantee the same results in the future

NZDUSD, “New Zealand Dollar vs US Dollar”

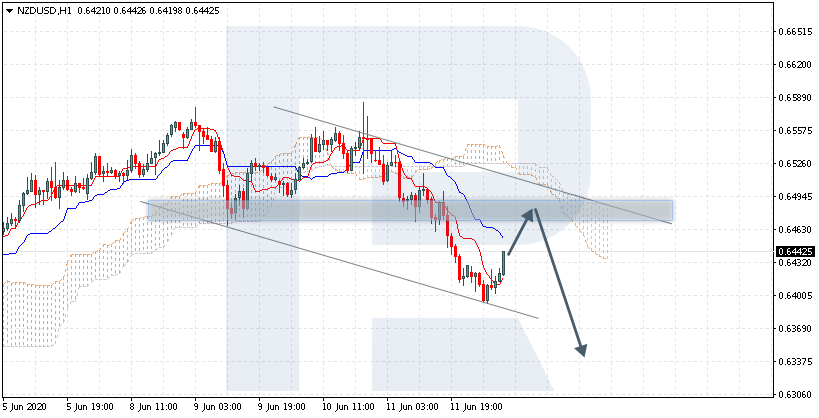
NZDUSD is trading at 0.6442; the instrument is moving below Ichimoku Cloud, thus indicating a descending tendency. The markets could indicate that the price may test the cloud’s downside border at 0.6480 and then resume moving downwards to reach 0.6335. Another signal in favor of further downtrend will be a rebound from the resistance level. However, the bearish scenario may be canceled if the price breaks the cloud’s upside border and fixes above 0.6555. In this case, the pair may continue growing towards 0.6645.

NZDUSD

Article By RoboForex.com

Attention!
Forecasts presented in this section only reflect the author’s private opinion and should not be considered as guidance for trading. RoboForex LP bears no responsibility for trading results based on trading recommendations described in these analytical reviews.

Fibonacci Retracements Analysis 12.06.2020 (BITCOIN, ETHEREUM)

Article By RoboForex.com

BTCUSD, “Bitcoin vs US Dollar”

As we can see in the H4 chart, there haven’t been a lot of changes much after the divergence but they are about to come quite soon. After finishing a two-week ascending correction, BTCUSD has plummeted to update its local lows. Such a movement indicates a potential for further decline towards 23.6% and 38.2% fibo at 8846.00 and 7907.00 respectively. The resistance is the high at 10368.40.

BTCUSD
Risk Warning: the result of previous trading operations do not guarantee the same results in the future

In the H1 chart, after completing the correction, BTCUSD is trading towards the post-correctional extension area between 138.2% and 161.8% fibo at 8870.00 and 9033.70 respectively. The next target is 23.6% at 8846.00.

BITCOIN
Risk Warning: the result of previous trading operations do not guarantee the same results in the future

ETHUSD, “Ethereum vs. US Dollar”

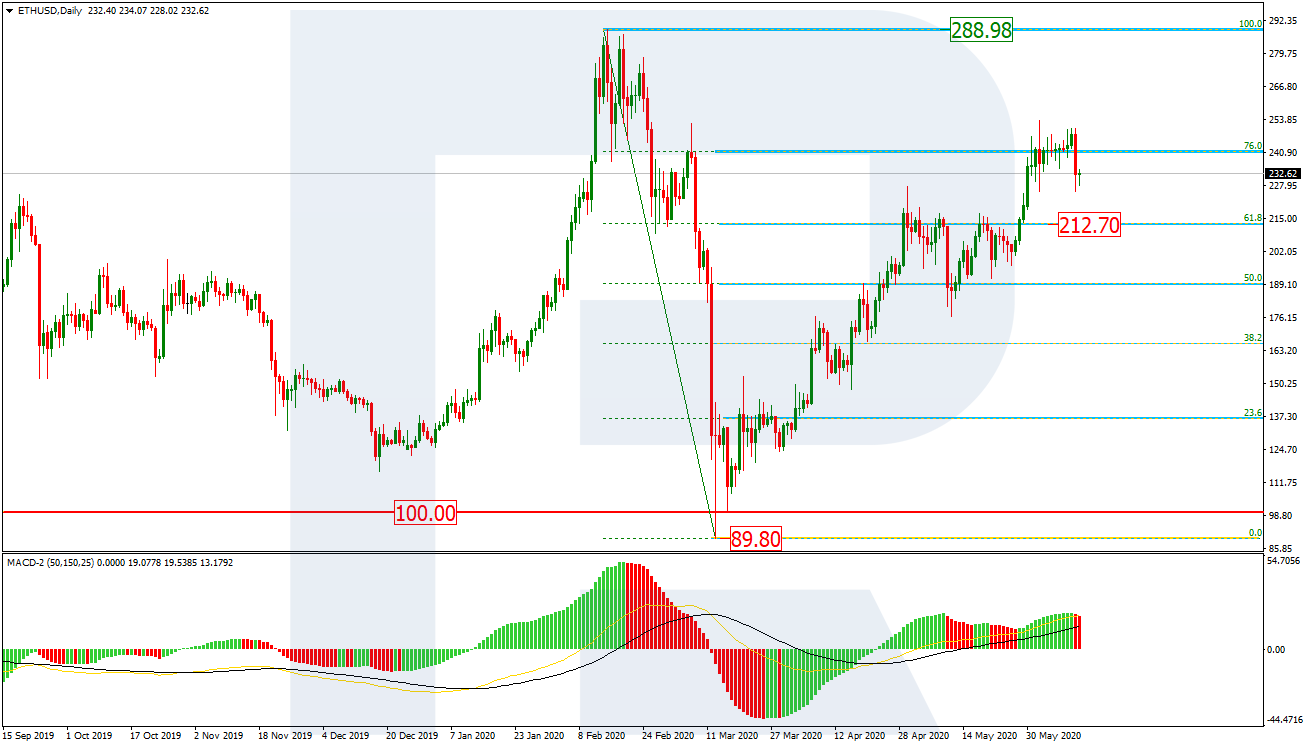
As we can see in the daily chart, the technical picture also hasn’t changed much over the previous week. ETHUSD is still trading not far from 76.0% fibo but there is a descending impulse towards the support at 61.8% fibo (212.70). If the price breaks this level, the mid-term trend may reverse. At the same time, it’s too early to exclude a possibility of further growth towards the fractal high at 288.98..

ETHUSD
Risk Warning: the result of previous trading operations do not guarantee the same results in the future

The H4 chart shows a more detailed structure of this descending impulse after the divergence. The correctional targets are 23.6%, 38.2%, and 50.0% fibo at 214.90, 191.00, and 171.60 respectively. However, if the instrument breaks the high at 253.47, the price may continue trading upwards.

ETHER

Article By RoboForex.com

Attention!
Forecasts presented in this section only reflect the author’s private opinion and should not be considered as guidance for trading. RoboForex LP bears no responsibility for trading results based on trading recommendations described in these analytical reviews.

Demand for Risky Assets Has Weakened

by JustForex

During yesterday’s trading session, the greenback strengthened significantly against a basket of world currencies. The dollar index (#DX) closed in the green zone (+0.82%). Major stock indices and “black gold” prices have fallen sharply. Financial market participants are concerned about the second wave of COVID-19 outbreak. The United States reported more than 2 million coronavirus cases as of June 12, as well as a re-wave of infection in the most populous states.

The UK has published pessimistic economic releases. The Office for National Statistics reported that GDP fell by 20.4% (m/m), which is below market expectations at 18.7%. The volume of manufacturing production decreased by 24.3% compared to the forecasted value of 15.8%.

Oil quotes have set new local lows. Currently, futures for the WTI crude oil are testing the $36.00 mark per barrel. We recommend paying attention to the US Baker Hughes rig count at 20:00 (GMT+3:00).

Market indicators

Yesterday, there were aggressive sales in the US stock market: #SPY (-5.76%), #DIA (-6.81%), #QQQ (-4.95%).

The 10-year US government bonds yield has been growing. At the moment, the indicator is at the level of 0.70-0.71%.

The news feed on 2020.06.12:
  • – Eurozone industrial production at 12:00 (GMT+3:00).

by JustForex

The Fed plays into the hands of Euro bulls – EUR/USD yearly highs in focus

By Admiral Markets

Source: Economic Events June 12, 2020 – Admiral Markets’ Forex Calendar

The Euro continued with its bullish performance over the last days, making back all of its ‘losses’ after last week’s NFP report.

The main reason seems to be that market participants realized more and more that the NFP report was very likely a ‘fake’ report with the BLS stating that […]there was also a large number of workers who were classified as employed but absent from work.[…] and that […]if the workers who were recorded as employed but absent from work due to “other reasons” (…), the overall unemployment rate would have been about 3 percentage points higher than reported[…]

And after the Fed last Wednesday reinforced her dovish stance with the dot plot stating that it sees no rate hikes till the end of 2022, the combination of the EU commission’s proposal of a 750 Billion-Euro fiscal stimulus package and the ECB’s boost of its PEPP program to 1.35 trillion Euros last week on Thursday, started to play out again.

As a result, a further reduction of the US-EU-yield differential should be expected with the EUR/USD, as we currently focus on the region around 1.1400/50 USD on the upside.

A break higher makes further gains as high as 1.1700/1800 possible, nevertheless, EUR/USD traders should get a little careful due to the technical extended mode which reduces the short-term risk-reward-ratio to a more unattractive level:

Source: Admiral Markets MT5 with MT5-SE Add-on EUR/USD Daily chart (between April 12, 2019, to June 11, 2020). Accessed: June 11, 2020, at 10:00pm GMT – Please note: Past performance is not a reliable indicator of future results, or future performance.

In 2015, the value of the EUR/USD fell by 10.2%, in 2016, it fell by 3.2%, in 2017, it increased by 13.92%, 2018, it fell by 4.4%, 2019, it fell by 2.2%, meaning that after five years, it was down by 7.3%.

Discover the world’s #1 multi-asset platform

Admiral Markets offers professional traders the ability to trade with a custom, upgraded version of MetaTrader 5, allowing you to experience trading at a significantly higher, more rewarding level. Experience benefits such as the addition of the Market Heat Map, so you can compare various currency pairs to see which ones might be lucrative investments, access real-time trading data, and so much more. Click the banner below to start your FREE download of MT5 Supreme Edition!

Download MetaTrader 5 and begin trading today!

Disclaimer: The given data provides additional information regarding all analysis, estimates, prognosis, forecasts or other similar assessments or information (hereinafter “Analysis”) published on the website of Admiral Markets. Before making any investment decisions please pay close attention to the following:

  1. This is a marketing communication. The analysis is published for informative purposes only and are in no way to be construed as investment advice or recommendation. It has not been prepared in accordance with legal requirements designed to promote the independence of investment research, and that it is not subject to any prohibition on dealing ahead of the dissemination of investment research.
  2. Any investment decision is made by each client alone whereas Admiral Markets shall not be responsible for any loss or damage arising from any such decision, whether or not based on the Analysis.
  3. Each of the Analysis is prepared by an independent analyst (Jens Klatt, Professional Trader and Analyst, hereinafter “Author”) based on the Author’s personal estimations.
  4. To ensure that the interests of the clients would be protected and objectivity of the Analysis would not be damaged Admiral Markets has established relevant internal procedures for prevention and management of conflicts of interest.
  5. Whilst every reasonable effort is taken to ensure that all sources of the Analysis are reliable and that all information is presented, as much as possible, in an understandable, timely, precise and complete manner, Admiral Markets does not guarantee the accuracy or completeness of any information contained within the Analysis. The presented figures refer that refer to any past performance is not a reliable indicator of future results.
  6. The contents of the Analysis should not be construed as an express or implied promise, guarantee or implication by Admiral Markets that the client shall profit from the strategies therein or that losses in connection therewith may or shall be limited.
  7. Any kind of previous or modeled performance of financial instruments indicated within the Publication should not be construed as an express or implied promise, guarantee or implication by Admiral Markets for any future performance. The value of the financial instrument may both increase and decrease and the preservation of the asset value is not guaranteed.
  8. The projections included in the Analysis may be subject to additional fees, taxes or other charges, depending on the subject of the Publication. The price list applicable to the services provided by Admiral Markets is publicly available from the website of Admiral Markets.
Leveraged products (including contracts for difference) are speculative in nature and may result in losses or profit. Before you start trading, you should make sure that you understand all the risks

By Admiral Markets