Author Archive for InvestMacro – Page 24

Fibonacci Price Modeling Suggests Massive Resistance Range In US Markets

By TheTechnicalTraders 

– The big selloff in the US markets last week (-1600 pts in the Dow Jones) on the comments from the US Fed aligns with previous Fibonacci Price Trigger levels throughout the early portion of 2020 to create a massive Support/Resistance range in the markets according to our research team.  It is very likely that the big selloff bar from last week will also establish a minor Support/Resistance range within the price range of that big selloff bar.

One of the key technical components of our Fibonacci Price Modeling system is that it acts as a trend following system, projects key target and reversal levels, and also highlights key trigger levels as price rotates up and down in different time frames.  The benefit we derive from this modeling system is that we can interpret the data into various forms of key technical factors for our friends, followers, and members.

Before you continue, be sure to opt-in to our free market trend signals before closing this page, so you don’t miss our next special report!

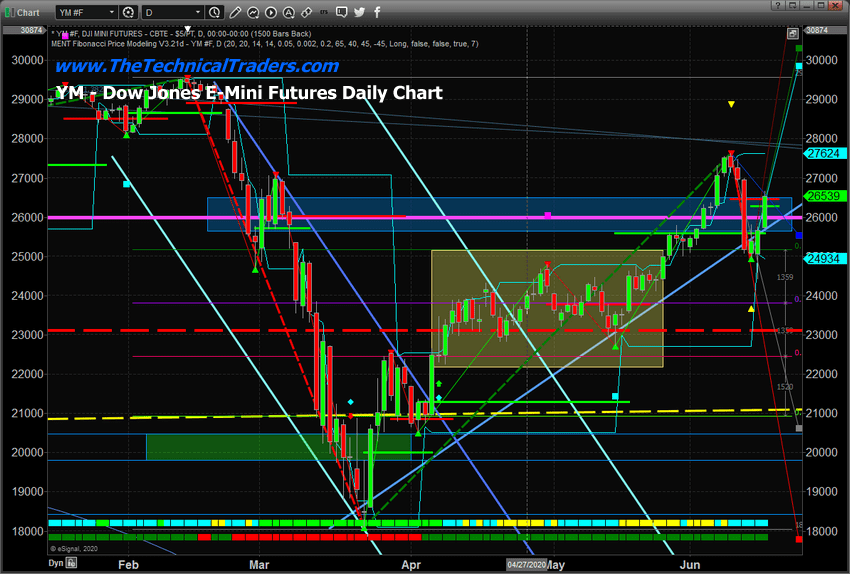
YM – DOW JONES DAILY CHART

Although this YM Daily chart, below, may be a bit complicated, pay attention to the BLUE SHADED RECTANGLE between 25,600 and 26,500.  Additionally, pay attention to the heavy MAGENTA LINE near 26,000.  This rectangle and the magenta line are derived from Fibonacci Trigger levels generated by our Fibonacci Price Modeling system.

You can see these Trigger Levels as GREEN and RED horizontal lines drawn just below new price peaks or just above new price bottoms.  Fibonacci Price Theory is based on tracking price peaks and troughs in a process as price attempts to trend higher or lower.  Our Fibonacci Price Modeling system attempts to adapt to price variances using a modified AI technology and attempts to highlight projected Trigger Levels and future potential Target Levels with each new price rotation.

Our researchers believe the BLUE RECTANGLE range will act as a major price support/resistance level after the big selloff bar last week.  This price range, totaling almost 1000 points, is likely to prompt volatile price rotation near or within this range as price attempts to either breakout to the upside or breakdown into a new Bearish trend.

If the price moves lower, below the 25,500 level, there are very few prior Fibonacci Trigger levels that offer support on the way down.  One, near 23,850, and additional deeper Trigger Levels near 20,000 to 20,850 are the only deeper reference points recently.  Thus, our researchers believe any price breakdown below 25,500 could prompt a very deep and fast price correction in the markets – setting up a potential double-bottom type of pattern.
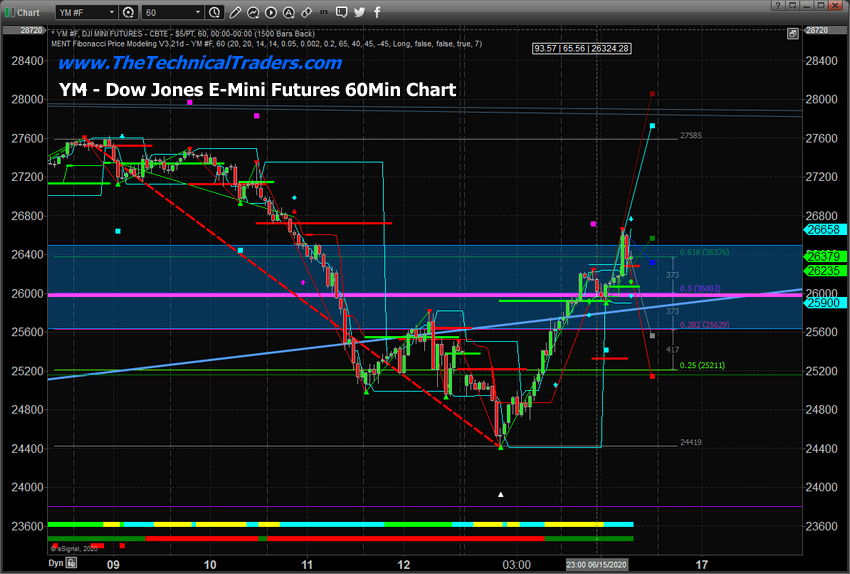
YM – DOW JONES 60 MINUTE CHART

This 60 Minute YM chart, generated about 70 minutes after the Daily chart, above, clearly shows how price reacted near the upper range of the BLUE Fibonacci Price Channel.  Almost immediately after attempting to breach the upper range of the support channel, the price collapsed back into the channel and wiped out close to 300+ points very quickly.

Our research team believes the 26,000 will continue to act as a key price level going forward.  The upward sloping price channel line, drawn as a LIGHT SKY-BLUE LINE through the recent downside price rotation, is another key price channel supporting the current market.  Once both of these levels are breached to the downside, there is very little support to be found before reaching the 23,850 level.
As we’ve been warning our friends and clients, this is the time to stay very cautious with your trades as volatility will likely continue to be elevated and bit price rotations are likely as we head into Q2 earnings season.  Everyone wants to see a strong recovery in the US markets and speculative traders are pushing in that direction.  The reality of the situation may be that we see a longer-term recovery taking place over the next 6 to 12+ months.

Right now, the YM price is still above the heavy Magenta support level.  We need to watch price activity as this level becomes critical for the price to attempt any future upside price moves.  If the price falls below this level, then a deeper price breakdown may be initiating.

As a technical analyst and trader since 1997, I have been through a few bull/bear market cycles in stocks and commodities. I believe I have a good pulse on the market and timing key turning points for investing and short-term swing traders. 2020 is an incredible year for traders and investors.  Don’t miss all the incredible trends and trade setups.

Subscribers of my Active ETF Swing Trading Newsletter had our trading accounts close at a new high watermark. We not only exited the equities market as it started to roll over in February, but we profited from the sell-off in a very controlled way with TLT bonds for a 20% gain. This week we closed out SPY ETF trade taking advantage of this bounce and entered a new trade with our account is at another all-time high value.

Ride my coattails as I navigate these financial markets and build wealth while others watch most of their retirement funds drop another 35-65% during the rest of this financial crisis going into late 2020 and early 2021.

If you have any type of retirement account and are looking for signals when to own equities, bonds, or cash, be sure to become a member of my Passive Long-Term ETF Investing Signals which we are about to issue a new signal for subscribers.

Chris Vermeulen
Chief Market Strategies
Founder of Technical Traders Ltd.

TheTechnicalTraders.com

Demand for Risky Assets Has Weakened Again. World Economic Recovery Is in Doubt

by JustForex

The US dollar is being traded in different directions against a basket of currency majors despite optimistic economic data. Thus, core retail sales index (m/m) grew by 12.4% in May instead of the forecasted growth by 5.5%. Retail sales (m/m) increased by 17.7% in May instead of 8.0%. At the same time, the Fed Chairman made ivestors upset with a statement that markets are unlikely to count on a quick recovery of the US and world economy.

Financial market participants are concerned about the second wave of the COVID-19 epidemic. The Chinese government is fighting a second outbreak of coronavirus. Today schools in Beijing were closed and an emergency was introduced in the city. Tensions between North and South Korea also increase after North Korea blew up a joint post office on Tuesday and threatened to send troops into the demilitarized zone.

The “black gold” prices have been declining. Currently, futures for the WTI crude oil are testing the $37.75 mark per barrel. At 17:30 (GMT+3:00), US crude oil inventories will be published.

Market indicators

Yesterday, there was the bullish sentiment in the US stock market: #SPY (+1.92%), #DIA (+2.12%), #QQQ (+1.72%).

The 10-year US government bonds yield is growing. At the moment, the indicator is at the level of 0.75-0.76%.

The news feed on 2020.06.17:
  • – UK consumer price index at 09:00 (GMT+3:00);
  • – Eurozone consumer price index at 12:00 (GMT+3:00);
  • – Statistics on the real estate market in the US at 15:30 (GMT+3:00);
  • – Inflation report in Canada at 15:30 (GMT+3:00).

by JustForex

Could China’s strategic pork reserve be a model for the US?

By David L. Ortega, Michigan State University

During the height of the coronavirus pandemic, we became accustomed to face-masked shoppers, social distancing and one-way aisles at the grocery store. But most shocking was the scene at the supermarket meat case.

Some meat processing plants closed or reduced capacity as workers contracted the virus. Disruptions to the supply chain resulted in shortages and price increases for beef and pork products. Purchase limits on meat and other items were reminiscent of wartime food rationing.

Ideas and solutions regarding the vulnerabilities of meat production have ranged from eliminating meat consumption to decentralizing meat production away from large packing plants to increasing automation of processing facilities.

Another solution may be to create a strategic meat reserve.

As a food and agricultural economist and Chinese food systems scholar, I have become very familiar with China’s strategic pork reserve and how the concept could apply in the United States.

China’s piggy bank

China is the world’s largest consumer and producer of pork.

The average Chinese person eats roughly 20 more pounds of pork per year than their American counterpart, with China producing over four times more pork than the U.S., or close to half of the world’s supply. Although the size of China’s strategic pork reserve is a tightly held state secret, Beijing calls upon these reserves when supplies run low.

Since August 2018, African swine fever, a highly contagious and deadly virus affecting pigs, has decimated China’s hog population. Millions of pigs, totaling more than 40% of China’s herd, have been killed by the virus or culled in an attempt to contain its spread. To control skyrocketing pork prices, China has tapped into its reserves.

When supplies run high, and prices get too low, the reserve is bolstered by increasing government demand. When supply is low, and prices get high, pork is released or auctioned into the market.

In the wake of African swine fever, this strategic pork reserve is one tool helping stabilize the market and ensure sufficient supply for consumers.

The United States and Canada are among the other countries with strategic reserves.
Dvortygirl/Wikimedia Commons, CC BY

American meat and Canadian syrup

While America’s recent experiences with meat supply disruptions are different, the resulting shortages and price increases are similar.

COVID-19 disruptions to the U.S. meat supply chain led to a nearly 40% temporary reduction in processing capacity, which resulted in significant increases in both wholesale and retail prices of pork and beef products in April and May. Meat production has since increased as processing plants have reopened.

While the U.S. does have substantial reserves of red meat in cold storage – 1.1 billion pounds, to be exact – these supplies are a tiny fraction of the over 50 billion pounds of meat produced annually and are not used in a strategic sense like China’s pork reserve.

But we don’t have to look on the other side of the world for examples of strategic food reserves. Our Canadian neighbors manage a strategic reserve of maple syrup which operates like a cartel.

A familiar concept

While some may find it radical, the idea of strategic reserves in the U.S. is not a new concept.

The United States Strategic Petroleum Reserve, with a storage capacity of 714 million barrels, was created to reduce the effects of oil supply disruptions and is an important foreign policy tool. And up until 2015, the United States had a National Raisin Reserve, which was created by the government following World War II to control prices.

The raisin reserve allowed producers to collectively influence supply, demand and prices. Likened to a government operated cartel, the U.S. Supreme Court ordered the reserve to cease operations, ruling it unconstitutional.

While a strategic reserve could help soften future meat supply disruptions, its ability to interfere with market operations is likely to be met with strong opposition. Moreover, a strategic reserve would require significant capital investments, industry coordination and increased government intervention.

It may not be time to start stockpiling the bacon yet, but it’s an idea worth considering if you want to avoid disappointment in the meat aisle.

About the Author:

David L. Ortega, Associate Professor of Food and Agricultural Economics, Michigan State University

This article is republished from The Conversation under a Creative Commons license. Read the original article.


Fibonacci Retracements Analysis 17.06.2020 (GBPUSD, EURJPY)

Article By RoboForex.com

GBPUSD, “Great Britain Pound vs US Dollar”

As we can see in the H4 chart, after updating the high and reaching the mid-term 50.0% fibo at 1.2892, GBPUSD started a new descending impulse due to the divergence and has already reached 23.6% fibo. The next downside targets may be 38.2%, 50.0%, and 61.8% fibo at 1.2277, 1.2110, and 1.1946 respectively. The resistance is the high at 1.2813. If the price breaks this level, the instrument may resume trading upwards.

GBPUSD_H4
Risk Warning: the result of previous trading operations do not guarantee the same results in the future

The H1 chart shows more detailed structure of the current descending movement. After the convergence, the pair is correcting to the upside. Considering the potential for a new rising impulse towards the high at 1.2813, the price may break it and then continue moving towards the post-correctional extension area between 138.2% and 161.8% fibo at 1.2861 and 1.2928 respectively.

GBPUSD_H1
Risk Warning: the result of previous trading operations do not guarantee the same results in the future

EURJPY, “Euro vs. Japanese Yen”

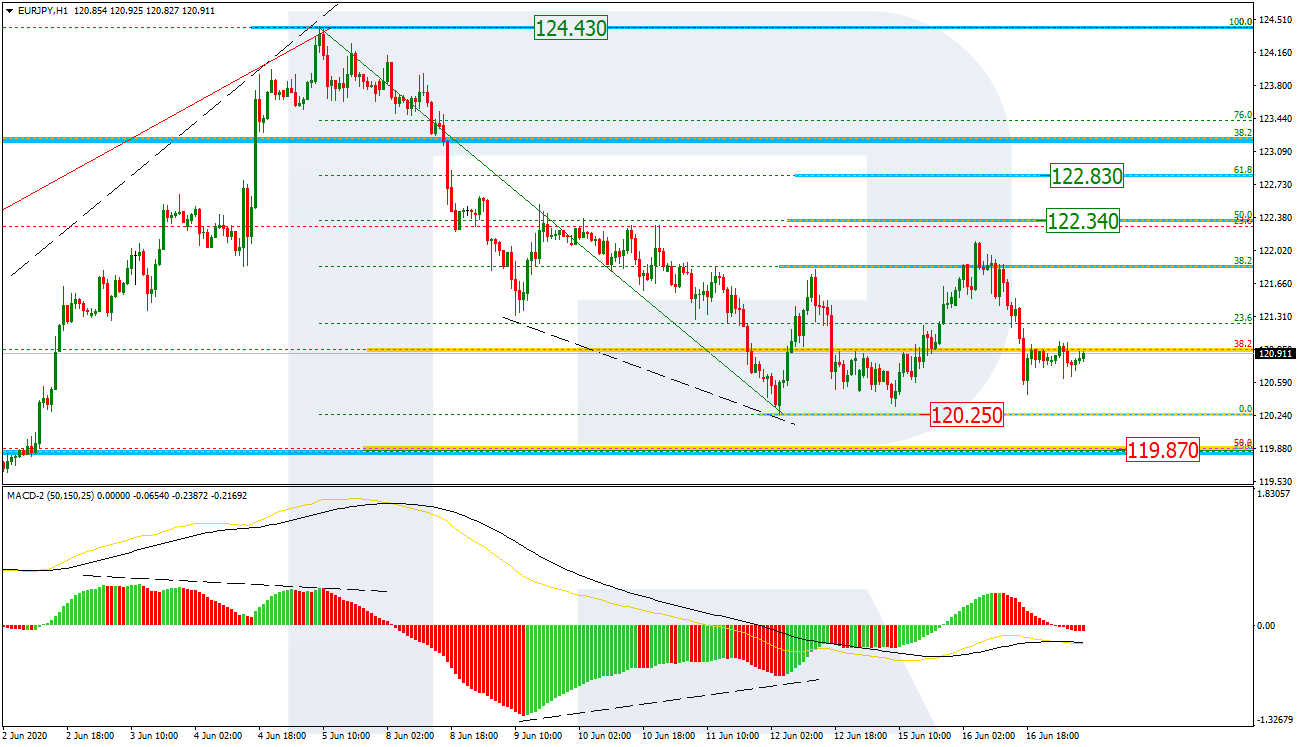
As we can see in the H4 chart, after reaching 38.2% fibo, EURJPY is correcting to the downside towards 50.0% and 61.8% fibo at 119.87 and 118.82 respectively. After finishing the pullback, the instrument may start a new rising wave towards the mid-term 50.0% fibo at 125.93 but only after breaking the high at 124.43.

EURJPY_H4
Risk Warning: the result of previous trading operations do not guarantee the same results in the future

In the H1 chart, EURJPY is correcting to the upside after completing the descending wave and has already reached 38.2% fibo. Later, the market may reach 50.0% and 61.8% % fibo at 122.34 and 122.83 respectively. However, if the price breaks the low at 120.25, it may resume the descending tendency.

EURJPY_H1

Article By RoboForex.com

Attention!
Forecasts presented in this section only reflect the author’s private opinion and should not be considered as guidance for trading. RoboForex LP bears no responsibility for trading results based on trading recommendations described in these analytical reviews.

Forex Technical Analysis & Forecast 17.06.2020

Article By RoboForex.com

EURUSD, “Euro vs US Dollar”

After finishing another descending wave at 1.1227, EURUSD is correcting. Possibly, the pair may reach 1.1280 and then fall to break 1.1222. Later, the market may continue trading downwards with the short-term target at 1.1178.

EURUSD
Risk Warning: the result of previous trading operations do not guarantee the same results in the future

GBPUSD, “Great Britain Pound vs US Dollar”

GBPUSD continues falling towards 1.2470. After reaching it, the instrument may break it to the downside and then continue trading downwards with the short-term predicted target at 1.2250.

GBPUSD
Risk Warning: the result of previous trading operations do not guarantee the same results in the future

USDRUB, “US Dollar vs Russian Ruble”

After completing the descending wave at 69.20 along with the correction towards 69.90, USDRUB has formed a new consolidation range around the latter level. If later the price breaks the range to the downside, the market may form a new descending structure to reach 67.90 at least; if to the upside – choose an alternative scenario and start another growth with the target at 72.00.

USDRUB
Risk Warning: the result of previous trading operations do not guarantee the same results in the future

USDJPY, “US Dollar vs Japanese Yen”

USDJPY continues trading downwards to reach 107.03. Later, the market may start another growth towards 108.20. However, if the price breaks 107.00 to the downside, the instrument may resume trading downwards with the target at 106.60.

USDJPY
Risk Warning: the result of previous trading operations do not guarantee the same results in the future

USDCHF, “US Dollar vs Swiss Franc”

USDCHF is still falling towards 0.9450. Possibly, today the pair may reach it and then form one more ascending structure to break 0.9560. Later, the market may continue trading upwards with the short-term target at 0.9650.

USDCHF
Risk Warning: the result of previous trading operations do not guarantee the same results in the future

AUDUSD, “Australian Dollar vs US Dollar”

AUDUSD is consolidating around 0.6900. Today, the pair may form a new descending wave towards 0.6800 and then grow to return to 0.6900. If later the price breaks the range to the downside, the market may resume trading downwards with the target at 0.6716.

AUDUSD
Risk Warning: the result of previous trading operations do not guarantee the same results in the future

BRENT

Brent is consolidating above 40.00. Possibly, today the pair may grow to reach 43.40. However, if the price breaks 40.00 to the downside, the market may form a new descending structure to break 38.89 and then continue the correction with the target at 36.50.

BRENT
Risk Warning: the result of previous trading operations do not guarantee the same results in the future

XAUUSD, “Gold vs US Dollar”

Gold is consolidating above 1716.00. According to the main scenario, the price is expected to resume trading downwards with the first target at 1698.00 and then start a new correction towards 1715.50.

GOLD
Risk Warning: the result of previous trading operations do not guarantee the same results in the future

BTCUSD, “Bitcoin vs US Dollar”

BTCUSD is forming a narrow consolidation range around 9500.00. Possibly, the pair may expand the range up to 9700.00 and then form a new descending structure to break 9100.00. Later, the market may continue trading inside the downtrend with the target at 8700.00.

BITCOIN
Risk Warning: the result of previous trading operations do not guarantee the same results in the future

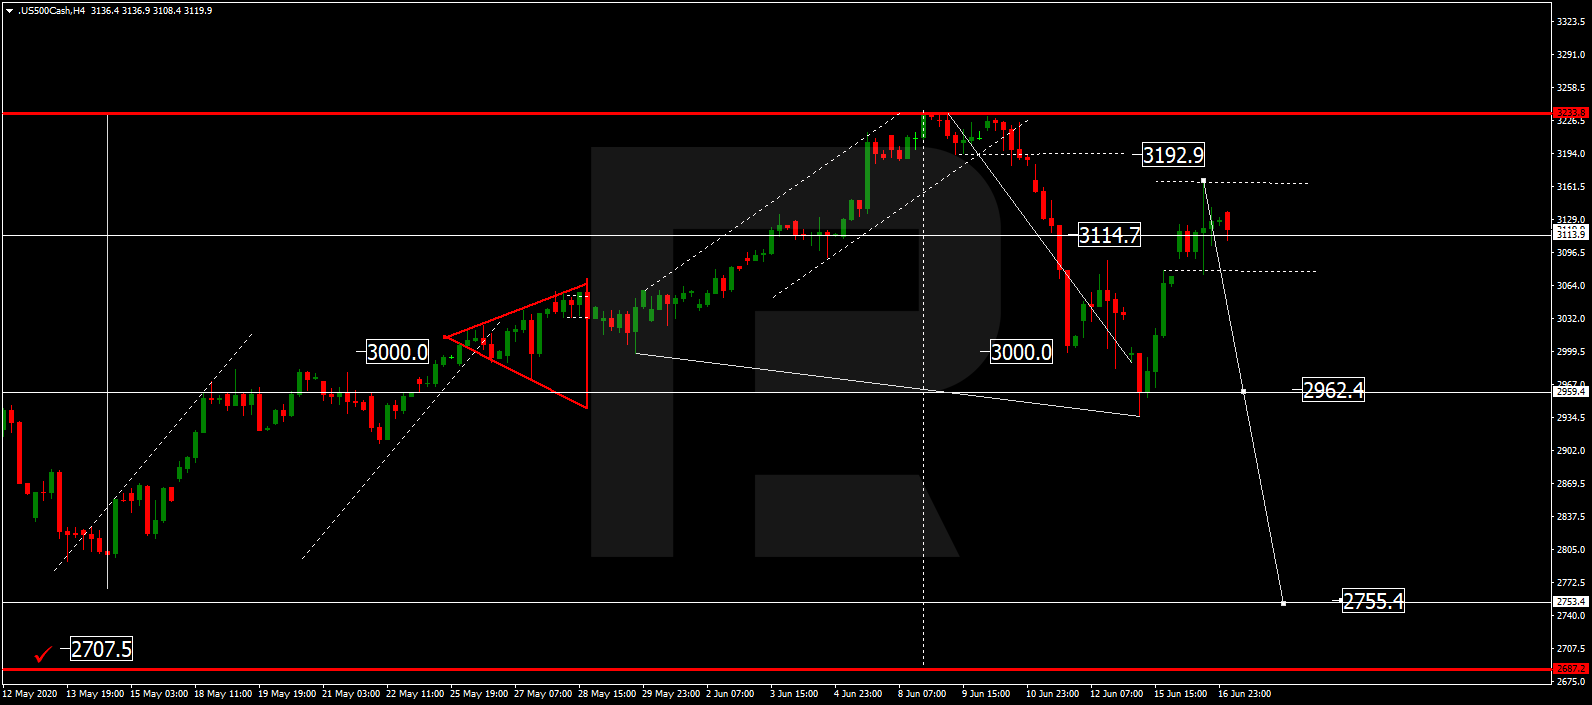
S&P 500

The Index is consolidating around 3115.0. If later the price breaks the range to the upside, the market may reach 3192.9; if to the downside at 3050.0 – form a new descending structure to break 2960.0 and then continue trading downwards with the short-term target at 2755.5.

S&P 500

Article By RoboForex.com

Attention!
Forecasts presented in this section only reflect the author’s private opinion and should not be considered as guidance for trading. RoboForex LP bears no responsibility for trading results based on trading recommendations described in these analytical reviews.

The Analytical Overview of the Main Currency Pairs on 2020.06.17

by JustForex

The EUR/USD currency pair

Technical indicators of the currency pair:
  • Prev Open: 1.13244
  • Open: 1.12620
  • % chg. over the last day: -0.53
  • Day’s range: 1.12360 – 1.12940
  • 52 wk range: 1.0777 – 1.1494

The demand for risky assets has weakened again. EUR/USD quotes have updated local lows. Investors are concerned about the second outbreak of coronavirus. The Fed Chairman Jerome Powell confirmed the grim picture of the prospects for economic recovery in the US after the COVID-19 virus pandemic. At the same time, positive data on US retail sales supported the greenback. Currently, the EUR/USD currency pair is consolidating in the range of 1.1225-1.1275. We recommend opening positions from these marks.

The Economic News Feed for 2020.06.17:
  • – Consumer price index in the Eurozone at 12:00 (GMT+3:00);
  • – A number of indicators on the real estate market in the US at 15:30 (GMT+3:00).

We also recommend paying attention to the speech by the Fed Chairman.

EUR/USD

Indicators signal the power of sellers: the price has fixed below 50 MA and 100 MA.

The MACD histogram is in the negative zone and continues to decline, which indicates the bearish sentiment.

Stochastic Oscillator is in the neutral zone, the %K line is below the %D line, which also gives a signal to sell EUR/USD.

Trading recommendations
  • Support levels: 1.1225, 1.1195, 1.1145
  • Resistance levels: 1.1275, 1.1310, 1.1350

If the price fixes below 1.1225, a further fall in EUR/USD quotes is expected. The movement is tending to 1.1190-1.1160.

An alternative could be the growth of the EUR/USD currency pair to 1.1310-1.1340.

The GBP/USD currency pair

Technical indicators of the currency pair:
  • Prev Open: 1.26050
  • Open: 1.25718
  • % chg. over the last day: -0.21
  • Day’s range: 1.25350 – 1.25886
  • 52 wk range: 1.1466 – 1.3516

The GBP/USD currency pair has been declining. The British pound has updated local lows. The demand for risky assets has weakened. At the moment, the key support and resistance levels are 1.2530 and 1.2600, respectively. A further drop in GBP/USD quotes is possible. We expect statistics on the real estate market in the US, as well as a speech by the Fed Chairman. We recommend opening positions from key levels.

In May, the UK consumer price index met market expectations and counted to +0.5% (y/y).

GBP/USD

Indicators signal the power of sellers: the price has fixed below 50 MA and 100 MA.

The MACD histogram is in the negative zone, which indicates the development of bearish sentiment.

Stochastic Oscillator is in the neutral zone, the %K line is below the %D line, which also gives a signal to sell GBP/USD.

Trading recommendations
  • Support levels: 1.2530, 1.2480, 1.2455
  • Resistance levels: 1.2600, 1.2675

If the price fixes below 1.2530, a further drop in GBP/USD quotes is expected. The movement is tending to 1.2480-1.2450.

An alternative could be the growth of the GBP/USD currency pair to 1.2640-1.2680.

The USD/CAD currency pair

Technical indicators of the currency pair:
  • Prev Open: 1.35668
  • Open: 1.35420
  • % chg. over the last day: -0.21
  • Day’s range: 1.35120 – 1.35719
  • 52 wk range: 1.2949 – 1.4668

The USD/CAD currency pair is in a sideways trend. There is no defined trend. The loonie is testing the following local support and resistance levels: 1.3510 and 1.3570, respectively. Financial market participants expect additional drivers. We recommend paying attention to the dynamics of oil quotes. Positions should be opened from key levels.

At 15:30 (GMT+3:00), a report on inflation will be published in Canada.

USD/CAD

Indicators do not give accurate signals: the price has fixed between 50 MA and 100 MA.

The MACD histogram has moved into the negative zone, which indicates the development of bearish sentiment.

Stochastic Oscillator is in the neutral zone, the %K line is above the %D line, which gives a signal to buy USD/CAD.

Trading recommendations
  • Support levels: 1.3510, 1.3455, 1.3390
  • Resistance levels: 1.3570, 1.3620, 1.3680

If the price fixes below 1.3510, USD/CAD quotes are expected to fall. The movement is tending to 1.3460-1.3430.

An alternative could be the growth of the USD/CAD currency pair to 1.3620-1.3680.

The USD/JPY currency pair

Technical indicators of the currency pair:
  • Prev Open: 107.325
  • Open: 107.292
  • % chg. over the last day: -0.01
  • Day’s range: 107.160 – 107.441
  • 52 wk range: 101.19 – 112.41

The USD/JPY currency pair is still being traded in a prolonged flat. There is no defined trend. The trading instrument continues to test the following key support and resistance levels: 107.05 and 107.65, respectively. The demand for “safe-haven” currencies has been resumed. We recommend paying attention to the dynamics of US government bonds yield. Positions should be opened from key levels.

During the Asian trading session, weak data on the trade balance of Japan have been published.

USD/JPY

Indicators do not give accurate signals: the price has crossed 50 MA.

The MACD histogram is near the 0 mark.

Stochastic Oscillator is near the overbought zone, the %K line has crossed the %D line. There are no signals at the moment.

Trading recommendations
  • Support levels: 107.05, 106.60
  • Resistance levels: 107.65, 108.20, 108.55

If the price fixes above 107.65, USD/JPY quotes are expected to rise. The movement is tending to 108.00-108.30.

An alternative could be a decrease in the USD/JPY currency pair to 106.70-106.40.

by JustForex

What’s up Gold? Gold bulls fail to regain control after the Fed

By Admiral Markets

Source: Economic Events June 17, 2020 – Admiral Markets’ Forex Calendar

After the Fed reinforced its dovish stance last Wednesday, and the Fed dot plot suggesting that it will keep interest rates at 0% at least through the end of 2022 while continuing to buy USTs and MBS at the current pace, we see a willingness to flatten the 2-10-year-US-yield curve once again. Because of this, Gold’s technical side has brightened once again.

But after an initial bullish stint, Gold suddenly dropped, and reaching 1,700 USD because its focus again.

This is surprising, as Equities dropped heavily too, alongside the Dow Jones Industrial Average dropping 6.9% on Thursday the day after the Fed, marking its 27th largest 1-day decline in history. The volatility index VIX spiked 48% that same day as well, making it the 7th largest 1-day percentage increase in history.

For us, it seems as if the Gold weakness may be driven by two factors:

  1. Margin Calls kicking in after Equities saw an enormous run from its March and yearly lows, while precious metals like Gold and Silver saw heavy gains, and no funding to finance Equity positions.
  2. The Fed’s balance sheet only increased by 4 billion USD over the last week, pointing to what is, by far, the smallest increase since February 2020.

That said, in our opinion it should be only a question of time to see the Fed increase the pace of its QE again, which should then act as a very bullish driver for Gold. As long as the precious metal trades above 1,660 USD, this could set the path up to the current all-time high of around 1,920 USD.

On the other hand: a drop below 1,660 USD could trigger a deeper correction, driving Gold below 1,600 USD, even though such a move should be considered only short-term:

Source: Admiral Markets MT5 with MT5-SE Add-on Gold Daily chart (between March 18, 2019, to June 16, 2020). Accessed: June 16, 2020, at 10:00pm GMT – Please note: Past performance is not a reliable indicator of future results, or future performance.

In 2015, the value of Gold fell by 10.4%, in 2016, it increased by 8.1%, in 2017, it increased by 13.1%, in 2018, it fell by 1.6%, in 2019, it increased by 18.9%, meaning that after five years, it was up by 28%.

Discover the world’s #1 multi-asset platform

Admiral Markets offers professional traders the ability to trade with a custom, upgraded version of MetaTrader 5, allowing you to experience trading at a significantly higher, more rewarding level. Experience benefits such as the addition of the Market Heat Map, so you can compare various currency pairs to see which ones might be lucrative investments, access real-time trading data, and so much more. Click the banner below to start your FREE download of MT5 Supreme Edition!

Download MetaTrader 5 and begin trading today!

Disclaimer: The given data provides additional information regarding all analysis, estimates, prognosis, forecasts or other similar assessments or information (hereinafter “Analysis”) published on the website of Admiral Markets. Before making any investment decisions please pay close attention to the following:

  1. This is a marketing communication. The analysis is published for informative purposes only and are in no way to be construed as investment advice or recommendation. It has not been prepared in accordance with legal requirements designed to promote the independence of investment research, and that it is not subject to any prohibition on dealing ahead of the dissemination of investment research.
  2. Any investment decision is made by each client alone whereas Admiral Markets shall not be responsible for any loss or damage arising from any such decision, whether or not based on the Analysis.
  3. Each of the Analysis is prepared by an independent analyst (Jens Klatt, Professional Trader and Analyst, hereinafter “Author”) based on the Author’s personal estimations.
  4. To ensure that the interests of the clients would be protected and objectivity of the Analysis would not be damaged Admiral Markets has established relevant internal procedures for prevention and management of conflicts of interest.
  5. Whilst every reasonable effort is taken to ensure that all sources of the Analysis are reliable and that all information is presented, as much as possible, in an understandable, timely, precise and complete manner, Admiral Markets does not guarantee the accuracy or completeness of any information contained within the Analysis. The presented figures refer that refer to any past performance is not a reliable indicator of future results.
  6. The contents of the Analysis should not be construed as an express or implied promise, guarantee or implication by Admiral Markets that the client shall profit from the strategies therein or that losses in connection therewith may or shall be limited.
  7. Any kind of previous or modeled performance of financial instruments indicated within the Publication should not be construed as an express or implied promise, guarantee or implication by Admiral Markets for any future performance. The value of the financial instrument may both increase and decrease and the preservation of the asset value is not guaranteed.
  8. The projections included in the Analysis may be subject to additional fees, taxes or other charges, depending on the subject of the Publication. The price list applicable to the services provided by Admiral Markets is publicly available from the website of Admiral Markets.

Leveraged products (including contracts for difference) are speculative in nature and may result in losses or profit. Before you start trading, you should make sure that you understand all the risks

By Admiral Markets

RoboMarkets Receives “Best Global Stocks Broker 2020” Award

June 15, 2020 – Limassol, Cyprus – RoboMarkets, the company that provides financial services to European clients, has become a winner in the nomination “Best Global Stocks Broker 2020”. This award is presented within the frameworks of “Global Forex Awards 2020 – B2B” to the most advanced and promising companies in the industry, which offer their client access to multi-purpose investment products and services on the stock market.

“Global Forex Awards 2020 – B2B” unites the world’s leading companies that made the greatest contribution to the development of trading solutions and innovations for the Forex market. Awards are given to the best representatives of the industry in providing liquidity, client services, order execution, affiliate conditions, and other important aspects of the Forex B2B market. The winners are decided by open voting among clients of the forex companies from all over the world.

Open voting to decide the winners was taking place throughout April 2020. More than 3,200 traders participated and voted more than 6,000 times for nominees in all categories. The winners were announced on June 5th, 2020.

Konstantin Rashap, RoboMarkets development manager in Europe: “We take this award as another confirmation that our efforts focused on complex development of services offered on the stock market proved to be very efficient. Our conditions for investments in stocks have become even more competitive recently, while the range of available assets has significantly expanded. The award we’ve received not only demonstrates our achievements but is also perceived as a motivation to keep development pace in order to provide our clients with the most cutting-edge professional services of the highest possible quality”.

About RoboMarkets

RoboMarkets is a European broker with the CySEC license No. 191/13. The Company offers brokerage services in many European countries by providing traders, who work on financial markets, with access to its proprietary trading platforms. More detailed information can be found on the official website at robomarkets.com.


Investors buoyed by extra U.S. stimulus to support recovery

By George Prior

Investors who have been “paying attention” have been topping–up their investment portfolios and will continue to do so, says the CEO of one of the world’s largest independent financial advisory and fintech organizations.

The comments from Nigel Green, the chief executive and founder of deVere Group, which has $12bn under advisement, come as stock markets around the world further rallied on Tuesday after the U.S. Federal Reserve announced an expansion to its historic stimulus programme.

Mr Green affirms: “Global stocks have been buoyed by the news from the Fed – the world’s de facto central bank – to buy individual corporate bonds in addition to the exchange-traded funds it is already purchasing, to support the world’s largest economy.

“This extra stimulus acts as a ‘backstop’ or ‘floor’ for equities.

“The additional Fed support was widely expected by the markets and therefore, investors who have been paying attention have been topping-up their investment portfolios recently as entry points will inevitably continue to go higher as we move forward.”

He continues: “It is likely that savvy investors will continue to enhance portfolios as the backing is likely to be maintained for years, not quarters.

“Also, it has been reported that President Donald Trump’s administration is preparing to unveil a $1 trillion infrastructure package. This will further boost asset prices.”

The deVere boss called the additional measures last week.

He noted on Thursday June 11: “Further stimulus can be expected from the Fed – and also perhaps from Congress too – in the near future… This will support and likely boost asset prices moving forward. Investors will now be eyeing the opportunities before any fresh or enhanced stimulus packages are announced.”

London’s FTSE 100 and Frankfurt’s Dax both jumped 2.2% in morning trading on Tuesday, the pan-European Euro Stoxx 600 gained 2%. U.S. futures markets suggested that U.S. stocks would rise further when trading begins on Wall Street, with S&P 500 futures up 1%.

In Asia-Pacific, Tokyo’s Topix shot up 4% and Australia’s S&P/ASX 200 gained 3.9%. Meanwhile, Hong Kong’s Hang Seng rose 2.4% while China’s CSI 300 index was 1.5% higher.

Nigel Green concludes: “Few things can fuel markets like another stimulus injection.

“The message investors are taking away is that the U.S. central bank and government are prepared to do whatever it takes to support the recovery.”

About:

deVere Group is one of the world’s largest independent advisors of specialist global financial solutions to international, local mass affluent, and high-net-worth clients.  It has a network of more than 70 offices across the world, over 80,000 clients and $12bn under advisement.


Worse-than-expected coronavirus contraction in ASEAN-4

By Dan Steinbock

– In the coming months, success or failure to contain the global pandemic and overcome the coronavirus contraction has potential to make or break the promise of Southeast Asia in the early 21st century.

By the end of the 2nd quarter, the total number of confirmed cases may total close to 10 million, while deaths could surpass 225,000. What was an epidemic in China at the turn of January and February grew into a pandemic in the 1st quarter, due to the belated and inadequate mobilizations in the US and Europe.

In early year, the epicenter of the virus was in China and the rest of Asia. By March-April, it had moved to Europe and the United States. As I projected three months ago, global devastation would escalate by summer as the epicenter is shifting to emerging and particularly developing economies.

The human costs of the global pandemic are mirrored by historical economic damage. As I predicted in early March, the economic impact of the coronavirus contraction would be comparable to the 1930s Great Depression. Recent World Bank data confirms the projection. The current baseline forecast envisions a whopping 5.2% contraction in global GDP in 2020.

The net effect will be the deepest global recession in eight decades, despite unprecedented policy support. As a result, per capita incomes and living standards in most emerging and developing economies will shrink this year. Meanwhile, across the world, economies are easing lockdown measures, trying to bring relief to those whose livelihoods have been drastically disrupted.

In Southeast Asia, the economic fallout has barely begun.

Pandemic impact on Southeast Asia

In the coming months, emerging and developing economies will seek to cope with the coming economic tsunami. With weaker healthcare systems, the poorest economies will take the heaviest hit. The populous economies in Southeast Asia – Indonesia, Philippines, Thailand and Vietnam, or the ‘ASEAN-4’ – are not an exception.

Among the ASEAN-4, the epidemic started with only 50 confirmed cases at the end of January. Yet, at the end of June, that figure is likely to be closer to 90,000. In five months, it has increased by more than 1,650 times.

At the end of the first quarter, Philippines was worst hit (2,084 confirmed cases), followed by Thailand (1,651), Indonesia (1,528) and Vietnam (212).

By the end of the 2nd quarter – that is, June 30 – the largest case counts are likely to be in Indonesia (over 52,000), followed by Philippines (over 32,000), Thailand (3,200) and Vietnam (some 340) (Figure 1).

Figure 1 Cumulative confirmed cases in ASEAN-4

Source: WHO data, Difference Group

Relative to the population size (total cases/1m pop), the pandemic impact among the ASEAN-4 has been hardest in the Philippines and Indonesia, where the cases are still on the rise, followed by Thailand and, far behind, Vietnam (Figure 2).

Figure 2 Total confirmed COVID-19 cases in selected ASEAN countries*

* Log.

Source: European CDC, Difference Group, Jan 26 – Jun 13, 2020

These comparisons rely on the assumption that the figures are valid. One way to assess that validity is testing. The more countries test, the more accurately the cases will reflect the actual impact, while the reverse applies as well.

Usually upper-middle-income countries, such as Thailand, have greater testing capacity than lower-middle income economies, such as the rest of ASEAN-4. Indeed, the intensity of testing (i.e., testing per 1 million people) across ASEAN-4 suggests that currently Thailand is testing most aggressively (about 6,700), followed by Philippines (4,500), Vietnam (2,800) and Indonesia (1,800).

Internationally, Vietnam has been portrayed as a pandemic success story, due to its low number of cases. The presumed success has been attributed to rigorous testing, young population, contract tracing and isolation. Yet, realities are different.

In fact, testing intensity suggests Vietnam is at par with Bangladesh and Mexico; there is little rigorous about it. Nor is young population a reason for the success. Median age in Vietnam (31) is slightly higher than in Indonesia (30) and far higher than in Philippines (24). That leaves contract tracing and isolation, which have been called “repressive” by critics.

Those countries that test relatively less are more likely to see new virus waves and residual clusters in the future. Moreover, they will face new challenges as the economy begins to ease lockdown measures and tourism will pick up. Such countries may also see surges in mortality rates, which may not be attributed to the pandemic, but to “pre-existing pulmonary conditions” and so on.

Economic impact on Southeast Asia

As the outbreak has spread, the disruption of supply chains and temporary plant shutdowns, coupled with a sudden full stop in global demand, weigh heavily on those ASEAN economies that rely on export-led growth, remittances, tourism and travel, retail, and so on.

After the first quarter, the expectation was that ASEAN-4 will all suffer a severe growth contraction in the 2nd quarter that will cast a long shadow over the year.

In Indonesia, the contraction would result in a plunge from 5.0% in 2019 to 0.5% in 2020; in the Philippines, from 5.9% to 0.6%; and in Thailand, from 2.4% to -6.7%, respectively. Better positioned, Vietnam’s GDP growth was expected to fall from 7.0% to 2.7%, if it could minimize the virus impact at home.

Only one quarter later, the expected plunge in 2020 has deteriorated in the Philippines, which is expected to enter negative territory (-2.5%). In Thailand, the plunge will be worse (-5.5%) but slightly improved from a quarter before. Indonesia (1.3%) and Vietnam (4.4%) would do better than expected a quarter ago (Figure 3).

Figure 3 Coronavirus contraction in ASEAN-4*

* Percent change, 2017-E2021 (GDP, constant prices)

Source: IMF data, Difference Group

Assuming a relatively strong rebound scenario, ASEAN economies could have a V-shaped rebound by 2021, when Vietnam and Indonesia (4 to 6%) could perform significantly better than Philippines and Thailand (3 to 4%)

However, since Indonesia and Vietnam have not tested adequately, economic performance in the two countries could face new downside risks if the pandemic may linger longer than expected. Conversely, Philippines and Thailand could benefit from upside risks, if they manage to keep the virus in check in the near future.

In Indonesia, external risks are cushioned but only to a degree by a narrowing current account deficit and increases in foreign-exchange reserves. As the country is easing the lockdown, recovery relies on the containment of further infection spread.

As Vietnam, as well as Singapore and Malaysia, have discovered, two years of trade wars and a few months of a global pandemic can undermine a decade of export recovery. In turn, countries that depend on both tourism and exports (Vietnam, Singapore, Malaysia) must cope with longer-term economic malaise.

In Thailand, the restart of the economy will be phased and should bring some relief in the second half of the year. Yet, recovery is likely to prove slow, due to the plunge in tourism and weakness in trade. Meanwhile, the central bank will try to keep the Thai baht below 30 per US dollar.

Philippines could have been better positioned against the crisis, but that advantage was largely lost with the 2019 budget debacle. It delayed the government’s vital infrastructure investment program, which now faces far tougher economic conditions.

Domestically, Philippines, too, must balance between targeted quarantines and gradual exit from the lockdown. In turn, consumption cannot thrive as long as supply remains limited and demand is restricted. Internationally, economic turmoil will affect Philippines through slower inflows of foreign investment, weaker export performance and significant reduction of remittances.

Margin for error slim to nil

Moreover, even the current baseline scenario could prove too optimistic. The challenges in the West could linger, while the devastation in emerging and developing economies could spill over the latter half of the year. In the US, Europe and elsewhere, new virus waves and residual clusters could ensue, while imported infections could accelerate toward 2020-21.

In turn, the development of vaccine and viral therapies could take longer than expected, while US tariff wars might pick up against China, Japan and South Korea, even Europe. And as the heavily-indebted advanced economies are now taking record-volumes of new debt to support their economies, they could face new debt crises, which would spill over to poorer countries.

In the near future, Southeast Asia will face the greatest risks (and opportunities) since World War II. The margin for error in pandemic containment and economic policies is now slim to nil.

About the Author:

Dr. Dan Steinbock is an internationally recognized strategist of the multipolar world and the founder of Difference Group. He has served at the India, China and America Institute (USA), Shanghai Institutes for International Studies (China) and the EU Center (Singapore). For more, see https://www.differencegroup.net