Author Archive for InvestMacro – Page 23

Can Asia end its uncontrolled consumption of wildlife? Here’s how North America did it a century ago

By Roland Kays, North Carolina State University

It was a dark time for animals. Poaching was rampant. Wild birds and mammals were being slaughtered by the thousands. An out-of-control wildlife trade was making once-common animals hard to find and pushing rare species into extinction.

This is the story of North America a century ago, and of Asia today. But there was a surprise ending in America, and I believe there could be one in Asia.

Today North America has abundant wildlife. Much of my research as a wildlife biologist focuses on documenting the rebound of species that once were hunted into scarcity, including wolves, deer and fishers.

This is the outcome of what I call the North American wildlife conservation miracle. A century ago, with many species on the brink of extinction, people here stopped overusing wildlife and created a new culture of conservation.

Today unregulated wildlife trade in Asia is decimating species in much of the world, and now even threatens humans through the likely spillover of the SARS-CoV-2 virus from bats or pangolins to humans. Suddenly the harm caused by this rampant wildlife trade is in the spotlight, which creates an opportunity to pull off a conservation miracle in Asia. I hope lessons from the American experience can help.

Out-of-control wildlife trade

In the late 1800s and early 1900s the seemingly endless bounty of America’s wildlife began to run out. By 1878, three northeast species – the Labrador duck, great auk and sea mink – went extinct. The eastern elk, the largest mammal in most eastern states, followed in the 1880s. Even highly resilient species like white-tailed deer and Canada goose declined sharply. Bison once numbered 30 million, but were down to a few hundred animals by the late 1880s.

The pioneer delusion of endless bounty was replaced by an acceptance that there was nothing they could do about it. American settlers had a “manifest destiny” mindset, believing they were destined to expand across the continent, and accepted that the loss of other species was an inevitable consequence of that.

Then the bison didn’t go extinct.
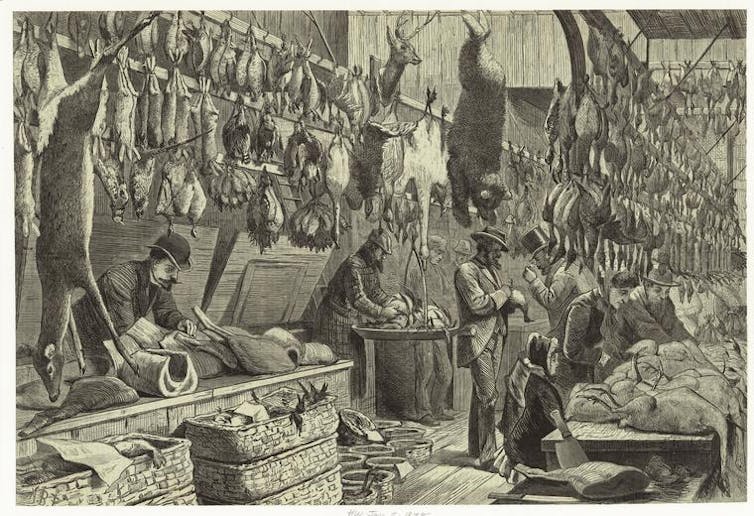
‘The Christmas Season,’ 1878, an engraving by Arthur Burdett Frost of a wild game stand at New York City’s Fulton Market showing a bear, deer and many types of birds.
NYPL

Back from the brink

For some Americans, including Theodore Roosevelt, the prospect of erasing an iconic species like bison was a call to action. They formed the American Bison Society, which bred bison at New York’s Bronx Zoo and shipped them west in hope of repopulating their former ranges.

As president, Roosevelt helped create some of the first national wildlife refuges and signed laws restricting the wildlife trade. But the bulk of the work was done by states and individuals.

Americans spoke out against large-scale hunting. George Bird Grinnell, editor of the sporting journal Forest and Stream, used the magazine as a platform to call for protecting birds. Grinnell later teamed with Teddy Roosevelt to create the Boone and Crockett Club, a group of conservation-minded hunters. Two Boston socialites, Harriet Hemenway and Minna Hall, formed the Massachusetts Audubon Society and worked to end the custom of adorning ladies’ hats with plumes from wild birds.

By the 1930s every state had a wildlife agency funded by taxes and hunting license fees. These agencies shut down most wildlife harvests, protected and restored habitat and reintroduced animals that had been eradicated, such as turkeys and otters.

The first U.S. ‘duck stamp,’ issued by the federal government in 1934. Purchase of a current duck stamp is required to hunt migratory waterbirds, with proceeds funding migratory bird conservation.
USFWS

When hunting resumed, states managed when it could take place and how many animals a person could harvest. Ecology was a new field, and scientists like Aldo Leopold adapted its principles to create wildlife management as a new branch of study that could help inform these regulations.

Today deer, turkey, bear, elk, ducks and geese are abundant in many parts of North America. State governments carefully regulate harvests. Wildlife is not sold commercially for food in the U.S., unlike Australia and much of Europe. Trapping and sale of fur-bearing animals like beaver and fisher is managed sustainably.

Of course, wildlife conservation in North America still faces serious challenges, including habitat loss, climate change and pollution. But unsustainable hunting is no longer a problem, and legal hunting helps fund conservation for all species.

Will Asia stop eating wildlife?

Over the last 20 years, demand for wildlife products in Asia has driven a collapse of animal populations there, as well as in Africa and Latin America. Most larger mammal species outside of North America today are primarily threatened by poaching for food, art and traditional medicines of dubious effectiveness.

But it seems no species have been safe from this scourge. Consumers will pay high prices for exotic dishes like braised salamander and soup made from the swim bladder of the totoaba, a giant Mexican fish.

Conservationists hope to seize on the tragedy of the SARS-Cov-2 spillover to end the global wildlife trade, or at least regulate it more tightly. What lessons can the North American experience offer?

First, it is critical to reduce demand. This was a slow process a century ago. But COVID-19 has cast a stigma on wildlife products that could help turn the tide in Asia, just as public shaming in the U.S. helped end demand for things like feather hats and fur from spotted cats.

Today animal welfare advocates are using social media to urge Asian consumers to avoid products made from endangered animals. In response to efforts like these, China banned domestic sales of ivory in 2017, and Chinese consumption of shark fin soup has declined sharply over the past decade.

Former NBA star Yao Ming has campaigned for a decade to reduce Chinese demand for wildlife products.

Second, this effort will involve many players, including national governments, regional authorities and nongoverment organizations like Save Vietnam’s Wildlife, Bat Conservation India Trust and Save Pangolins. These groups understand local culture and politics, and can connect directly with communities where wildlife is hunted and sold.

Finally, we need some optimism. The persistence of the bison a century ago showed Americans that extinction wasn’t the only option. It is important now to monitor wildlife populations so that efforts can target species most at risk, and to celebrate recoveries that might be early signs of a second conservation miracle.

About the Author:

Roland Kays, Research Associate Professor of Wildlife and Scientist at NC Museum of Natural Sciences, North Carolina State University

This article is republished from The Conversation under a Creative Commons license. Read the original article.


Forex Technical Analysis & Forecast 19.06.2020

Article By RoboForex.com

EURUSD, “Euro vs US Dollar”

EURUSD has expanded the consolidation range down to 1.1185. Possibly, today the pair may grow to test 1.1222 from below and then resume trading downwards with the short-term target at 1.1100.

EURUSD
Risk Warning: the result of previous trading operations do not guarantee the same results in the future

GBPUSD, “Great Britain Pound vs US Dollar”

GBPUSD continues forming the third wave within the downtrend. Today, the pair may correct to test 1.2470 from below and then resume trading downwards with the short-term target at 1.2250.

GBPUSD
Risk Warning: the result of previous trading operations do not guarantee the same results in the future

USDRUB, “US Dollar vs Russian Ruble”

USDRUB is consolidating around 69.90. Possibly, today the pair may fall to break 69.00 and then continue falling with the target at 68.75 or even 67.50. However, if the price breaks the range to the upside, the market may continue the correction towards 71.00.

USDRUB
Risk Warning: the result of previous trading operations do not guarantee the same results in the future

USDJPY, “US Dollar vs Japanese Yen”

USDJPY continues falling towards 106.60. After that, the instrument may correct to test 107.10 from below then resume trading downwards with the target at 106.00.

USDJPY
Risk Warning: the result of previous trading operations do not guarantee the same results in the future

USDCHF, “US Dollar vs Swiss Franc”

USDCHF is still consolidating around 0.9500. Possibly, today the pair may fall to reach 0.9450 and then form one more ascending structure to break 0.9550. Later, the market may continue trading upwards with the short-term target at 0.9650.

USDCHF
Risk Warning: the result of previous trading operations do not guarantee the same results in the future

AUDUSD, “Australian Dollar vs US Dollar”

AUDUSD is consolidating around 0.6900. Today, the pair may form a new descending wave towards 0.6800 and then grow to return to 0.6900. If later the price breaks the range to the downside, the market may resume trading downwards with the short-term target at 0.6716.

AUDUSD
Risk Warning: the result of previous trading operations do not guarantee the same results in the future

BRENT

Brent is moving upwards. Possibly, the pair may break 41.67 and then continue growing to reach 42.77 or even 43.43. After that, the instrument may start a new correction towards 41.65 and then form one more ascending structure with the target at 47.50.

BRENT
Risk Warning: the result of previous trading operations do not guarantee the same results in the future

XAUUSD, “Gold vs US Dollar”

After completing the descending impulse towards 1720.00, Gold is correcting towards 1729.00. Today, the pair may fall to reach 1705.00 and then form one more ascending structure towards 1715.00. Later, the market may start another decline with the first target at 1697.77.

GOLD
Risk Warning: the result of previous trading operations do not guarantee the same results in the future

BTCUSD, “Bitcoin vs US Dollar”

BTCUSD is falling to break 9000.00. After that, the instrument may continue trading inside the downtrend towards 8700.00 or even with the short-term target at 7950.00.

BITCOIN
Risk Warning: the result of previous trading operations do not guarantee the same results in the future

S&P 500

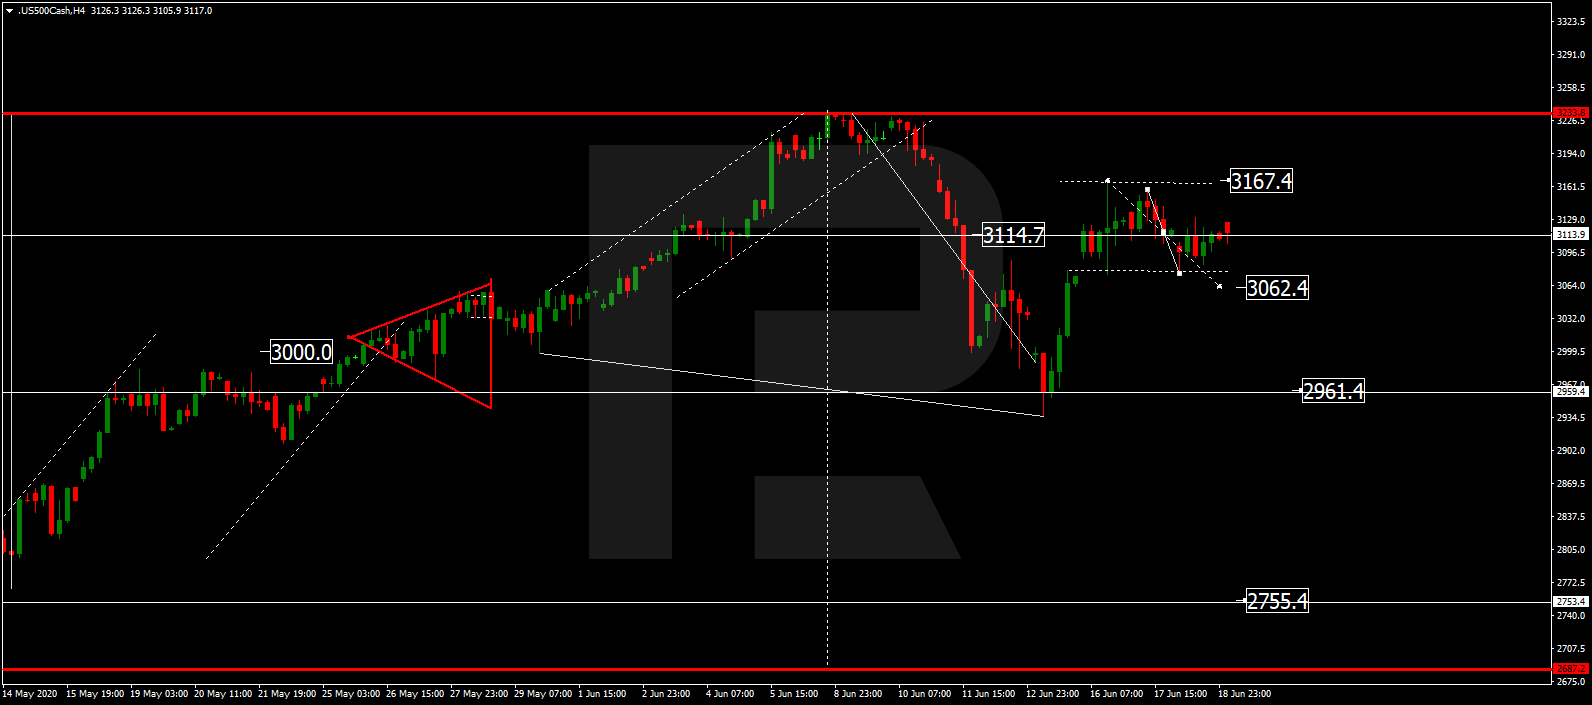
The Index is consolidating around 3115.0 without any particular direction. Possibly, the asset may expand the range down to 3062.5 and then form one more ascending structure to return to 3115.0. Later, the market may start a new decline to break 2961.4 and then continue trading downwards with the short-term target at 2755.5.

S&P 500

Article By RoboForex.com

Attention!
Forecasts presented in this section only reflect the author’s private opinion and should not be considered as guidance for trading. RoboForex LP bears no responsibility for trading results based on trading recommendations described in these analytical reviews.

Fibonacci Retracements Analysis 19.06.2020 (BITCOIN, ETHEREUM)

Article By RoboForex.com

BTCUSD, “Bitcoin vs US Dollar”

In the H4 chart, Bitcoin continues falling slowly after the divergence. The structure of the current movement suggests a weak bearish pressure and a possible rising impulse. However, it won’t happen until the price breaks the high at 103.68.40. Despite the fact that the current decline is very slow, the main scenario still implies that the instrument may continue trading downwards. The previous descending impulse attempted to reach 23.6% fibo at 8845.00, so the next one may reach 38.2% and 50.0% fibo at 7912.00 and 7152.00 respectively.

BTCUSD_H4
Risk Warning: the result of previous trading operations do not guarantee the same results in the future

As we can see in the H1 chart, after the pair entered the post-correctional extension area between 138.2% and 161.8% fibo at 9033.70 and 8870.00 respectively, there was a convergence on MACD, which resulted in a new rising correction that has already reached 61.8% fibo. Possibly, the asset may start a new impulse to the upside to reach 76.0% fibo at 9732.00. However, if the price breaks the low at 8905.00, it may resume the mid-term downtrend.

BTCUSD_H1
Risk Warning: the result of previous trading operations do not guarantee the same results in the future

ETHUSD, “Ethereum vs. US Dollar”

As we can see in the H4 chart, Ethereum continues correcting downwards after the divergence. The closest downside target is 23.6% fibo at 214.90, while the next ones are 38.2% and 50.0% fibo at 191.00 and 171.60 respectively. The resistance is the high at 253.47.

ETHUSD_H4
Risk Warning: the result of previous trading operations do not guarantee the same results in the future

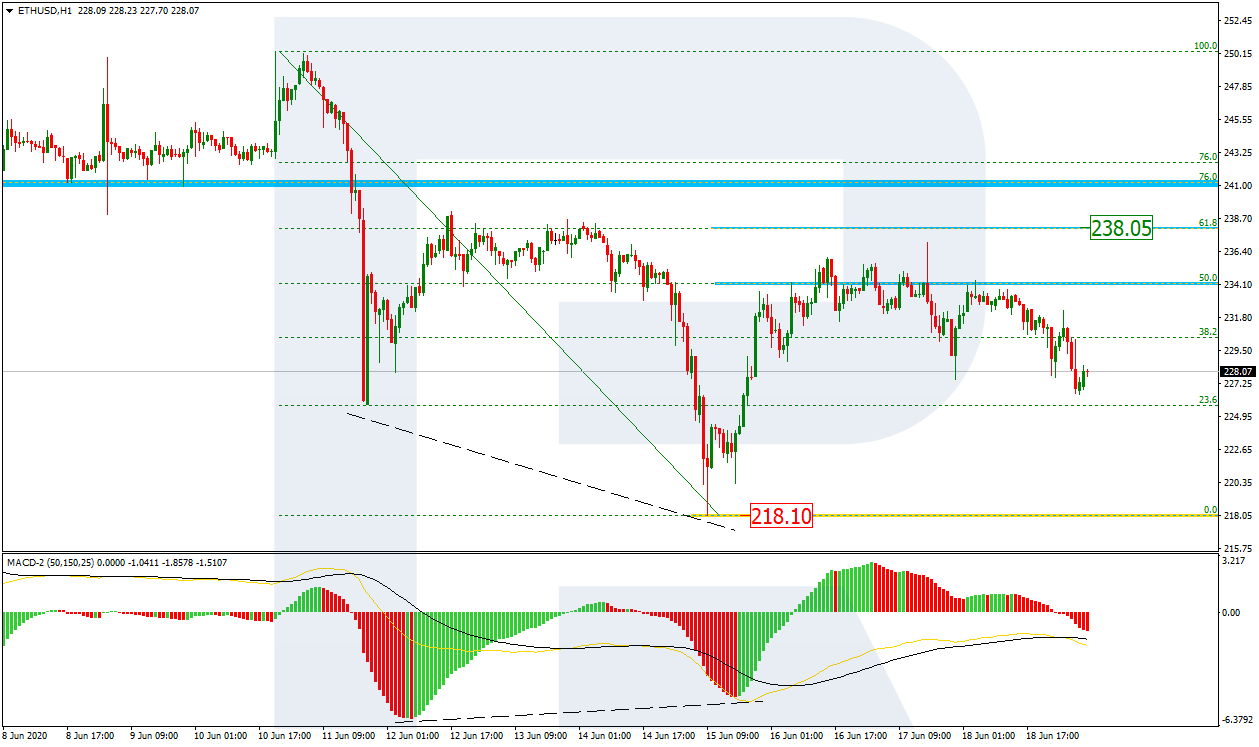
The H1 chart shows a more detailed structure of the current correction after the descending wave and the convergence. After breaking 61.8% fibo, the correctional uptrend has failed to reach 76.0% fibo at 238.05. The descending wave towards the low at 218.10 may result in another mid-term impulse to the downside.

ETHUSD_H1

Article By RoboForex.com

Attention!
Forecasts presented in this section only reflect the author’s private opinion and should not be considered as guidance for trading. RoboForex LP bears no responsibility for trading results based on trading recommendations described in these analytical reviews.

The Analytical Overview of the Main Currency Pairs on 2020.06.19

by JustForex

The EUR/USD currency pair

Technical indicators of the currency pair:
  • Prev Open: 1.12419
  • Open: 1.12032
  • % chg. over the last day: -0.36
  • Day’s range: 1.11986 – 1.12218
  • 52 wk range: 1.0777 – 1.1494

Sales prevail on the EUR/USD currency pair. Quotes have updated local lows. The demand for risky assets is still low amid growing concerns about the second wave of the COVID-19 epidemic. The tension between Washington and Beijing has come to the fore again. Donald Trump threatened again to cut ties with China yesterday. Currently, the EUR/USD currency pair is consolidating in the range of 1.1190-1.1230. We do not exclude a further decline in the euro against the greenback. Positions should be opened from key levels.

The Economic News Feed for 2020.06.19:
  • Today we recommend paying attention to the summit of EU leaders, as well as to the speech by the Fed Chairman.
EUR/USD

Indicators signal the power of sellers: the price has fixed below 50 MA and 100 MA.

The MACD histogram is in the negative zone, but above the signal line, which gives a weak signal to sell EUR/USD.

Stochastic Oscillator is in the neutral zone, the %K line is below the %D line, which indicates the development of bearish sentiment.

Trading recommendations
  • Support levels: 1.1190, 1.1160
  • Resistance levels: 1.1230, 1.1260, 1.1290

If the price fixes below 1.1190, a further fall in EUR/USD quotes is expected. The movement is tending to 1.1160-1.1140.

An alternative could be the growth of the EUR/USD currency pair to 1.1250-1.1280.

The GBP/USD currency pair

Technical indicators of the currency pair:
  • Prev Open: 1.25400
  • Open: 1.24180
  • % chg. over the last day: -1.04
  • Day’s range: 1.24048 – 1.24562
  • 52 wk range: 1.1466 – 1.3516

GBP/USD quotes have been declining again. The British pound has updated local lows. Currently, the GBP/USD currency pair is consolidating. The local support and resistance levels are 1.2400 and 1.2455, respectively. Yesterday, the Bank of England, as expected, kept the key marks of monetary policy at the same level. The demand for risky assets is still low. A further fall in GBP/USD quotes is possible. Positions should be opened from key levels.

The UK published optimistic retail sales data for May.

GBP/USD

Indicators signal the power of sellers: the price has fixed below 50 MA and 100 MA.

The MACD histogram is in the negative zone, but above the signal line, which gives a weak signal to sell GBP/USD.

Stochastic Oscillator is in the neutral zone, the %K line is below the %D line, which indicates the bearish sentiment.

Trading recommendations
  • Support levels: 1.2400, 1.2350
  • Resistance levels: 1.2455, 1.2510, 1.2565

If the price fixes below 1.2400, a further drop in GBP/USD quotes is expected. The movement is tending to 1.2360-1.2340.

An alternative could be the growth of the GBP/USD currency pair to 1.2500-1.2530.

The USD/CAD currency pair

Technical indicators of the currency pair:
  • Prev Open: 1.35710
  • Open: 1.36010
  • % chg. over the last day: +0.27
  • Day’s range: 1.35697 – 1.36154
  • 52 wk range: 1.2949 – 1.4668

The USD/CAD currency pair is still being traded in a prolonged flat. There is no defined trend. Currently, the following local support and resistance levels can be distinguished: 1.3560 and 1.3615, respectively. Investors expect important economic releases from Canada. The growth of loonie against the US currency is possible. The Canadian dollar is supported by the positive dynamics of “black gold” prices. Positions should be opened from key levels.

At 15:30 (GMT+3:00), a report on retail sales will be published in Canada.

USD/CAD

Indicators do not give accurate signals: the price is consolidating near 50 MA.

The MACD histogram is near the 0 mark.

Stochastic Oscillator is in the neutral zone, the %K line has crossed the %D line. There are no signals at the moment.

Trading recommendations
  • Support levels: 1.3560, 1.3510, 1.3455
  • Resistance levels: 1.3615, 1.3680

If the price fixes below 1.3560, USD/CAD quotes are expected to fall. The movement is tending to the round level of 1.3500.

An alternative could be the growth of the USD/CAD currency pair to 1.3650-1.3680.

The USD/JPY currency pair

Technical indicators of the currency pair:
  • Prev Open: 107.003
  • Open: 106.941
  • % chg. over the last day: -0.03
  • Day’s range: 106.792 – 107.056
  • 52 wk range: 101.19 – 112.41

The USD/JPY currency pair continues to be traded in a prolonged flat. The technical pattern is ambiguous. The trading instrument is testing local support and resistance levels: 106.60 and 107.15, respectively. Financial market participants expect additional drivers. We recommend paying attention to the dynamics of US government bonds yield. Positions should be opened from key levels.

The news feed on Japan’s economy is calm.

USD/JPY

Indicators do not give accurate signals: the price is consolidating near 50 MA.

The MACD histogram is near the 0 mark.

Stochastic Oscillator is in the neutral zone, the %K line is above the %D line, which indicates the bullish sentiment.

Trading recommendations
  • Support levels: 106.60, 106.00
  • Resistance levels: 107.15, 107.65, 108.20

If the price fixes below 106.60, USD/JPY quotes are expected to fall. The movement is tending to the round level of 106.00.

An alternative could be the growth of the USD/JPY currency pair to 107.60-107.90.

by JustForex

The Demand for Risky Assets Is Still Low. The Conflict Between Washington and Beijing Is in the Spotlight

by JustForex

The US dollar has continued to grow against currency majors. The US dollar index closed in the green zone (+0.26%). Investors are concerned about the second wave of coronavirus. Thus, the number of infections has already exceeded 8.5 million people worldwide. Also, the pessimistic economic data were published in the US yesterday. Initial jobless claims have grown again and counted to 1.508K, while experts expected 1.300K. Investors have taken a wait-and-see attitude before the summit of EU leaders to be held today.

Recently, US Secretary of State Mike Pompeo held talks with Beijing. After the talks, US President Donald Trump has threatened again to cut ties with China. The White House administration said the United States was disappointed with China’s attitude during a meeting between Pompeo and Yang Jiechi, a high-ranking official of the Chinese Communist Party. The United States does not see any signs of progress in the deal, the obligations of which Beijing should fulfill.

The “black gold” prices have been growing. OPEC and partners have promised to fulfill their commitments to reduce production. Currently, futures for the WTI crude oil are testing the $40.10 mark per barrel. At 20:00 (GMT+3:00), Baker Hughes US rig count will be published.

Market indicators

Yesterday, there was a variety of trends in the US stock market: #SPY (+0.04%), #DIA (-0.14%), #QQQ (+0.27%).

The 10-year US government bonds yield has declined. At the moment, the indicator is at the level of 0.71-0.72%.

The news feed on 2020.06.19:
  • – UK retail sales data at 09:00 (GMT+3:00);
  • – Statistics on retail sales in Canada at 15:30 (GMT+3:00).

We also recommend paying attention to the speech by the Fed Chairman.

by JustForex

EUR/USD about to trigger long against 1.1200, could we see 1.1400 or higher?

By Admiral Markets

Source: Economic Events June 19, 2020 – Admiral Markets’ Forex Calendar

The Euro lost some of its bullish momentum in the recent days, failing to break above 1.1400.

Still, the mode remains bullish, and we consider the short-term downard corrective move to 1.1150/1200 to be an attractive region from a risk-reward perspective, and anticipates a break above 1.1400/50.

Several Fed members may speak as we approach the weekly close, but the focus will primarily be on Powell’s speech at 5pm GMT. Nevertheless, it seems unlikely for Powell to say something which deviates from Tuesday’s testimony in front of the US congress.

While his speech should be quite neutral, one could certainly assume that the current ultra-dovish mode from the Fed will likely continue for a while, especially if we see heavier selling pressure in US equities.

That in mind, it leads us come to the conclusion that, while monetary and fiscal stimulus in the eurozone should result in European yields to rise, US yields should be expected to drop, making the yield differential between European and US yields narrow further, favouring gains in the EUR/USD.

A break above 1.1400/50 leaves the EUR/USD bullish potential up to the region around 1.1700/1.1800, while a drop below 1.1200 could trigger a deeper correction with a target around 1.1000:

Source: Admiral Markets MT5 with MT5-SE Add-on EUR/USD Daily chart (between April 19, 2019, to June 18, 2020). Accessed: June 18, 2020, at 10:00pm GMT – Please note: Past performance is not a reliable indicator of future results, or future performance.

In 2015, the value of the EUR/USD fell by 10.2%, in 2016, it fell by 3.2%, in 2017, it increased by 13.92%, 2018, it fell by 4.4%, 2019, it fell by 2.2%, meaning that after five years, it was down by 7.3%.

Discover the world’s #1 multi-asset platform

Admiral Markets offers professional traders the ability to trade with a custom, upgraded version of MetaTrader 5, allowing you to experience trading at a significantly higher, more rewarding level. Experience benefits such as the addition of the Market Heat Map, so you can compare various currency pairs to see which ones might be lucrative investments, access real-time trading data, and so much more. Click the banner below to start your FREE download of MT5 Supreme Edition!

Download MetaTrader 5 and begin trading today!

Disclaimer: The given data provides additional information regarding all analysis, estimates, prognosis, forecasts or other similar assessments or information (hereinafter “Analysis”) published on the website of Admiral Markets. Before making any investment decisions please pay close attention to the following:

  1. This is a marketing communication. The analysis is published for informative purposes only and are in no way to be construed as investment advice or recommendation. It has not been prepared in accordance with legal requirements designed to promote the independence of investment research, and that it is not subject to any prohibition on dealing ahead of the dissemination of investment research.
  2. Any investment decision is made by each client alone whereas Admiral Markets shall not be responsible for any loss or damage arising from any such decision, whether or not based on the Analysis.
  3. Each of the Analysis is prepared by an independent analyst (Jens Klatt, Professional Trader and Analyst, hereinafter “Author”) based on the Author’s personal estimations.
  4. To ensure that the interests of the clients would be protected and objectivity of the Analysis would not be damaged Admiral Markets has established relevant internal procedures for prevention and management of conflicts of interest.
  5. Whilst every reasonable effort is taken to ensure that all sources of the Analysis are reliable and that all information is presented, as much as possible, in an understandable, timely, precise and complete manner, Admiral Markets does not guarantee the accuracy or completeness of any information contained within the Analysis. The presented figures refer that refer to any past performance is not a reliable indicator of future results.
  6. The contents of the Analysis should not be construed as an express or implied promise, guarantee or implication by Admiral Markets that the client shall profit from the strategies therein or that losses in connection therewith may or shall be limited.
  7. Any kind of previous or modeled performance of financial instruments indicated within the Publication should not be construed as an express or implied promise, guarantee or implication by Admiral Markets for any future performance. The value of the financial instrument may both increase and decrease and the preservation of the asset value is not guaranteed.
  8. The projections included in the Analysis may be subject to additional fees, taxes or other charges, depending on the subject of the Publication. The price list applicable to the services provided by Admiral Markets is publicly available from the website of Admiral Markets.

Leveraged products (including contracts for difference) are speculative in nature and may result in losses or profit. Before you start trading, you should make sure that you understand all the risks

By Admiral Markets

Trump’s reported Bitcoin instruction shows he is out of touch: deVere CEO

By George Prior

Trump’s reported instruction to the U.S Treasury Secretary to ‘go after Bitcoin’ highlights how “backward-looking and out-of-touch” he is, says the CEO of one of the world’s largest independent financial advisory and fintech organizations.

The slamming indictment from Nigel Green, the chief executive and founder of deVere Group, follows revelations in the new book by former national security adviser John Bolton.

In ‘The Room Where It Happened’, Bolton says he heard Donald Trump tell Treasury Secretary Steven Mnuchin to “go after Bitcoin.”

Mr Green says: “It is highly likely that Trump did, indeed, launch an attack on Bitcoin. Last summer, he went on a Twitter tirade lambasting the world’s largest cryptocurrency.

“Assuming the instruction to the Treasury Secretary is true, it highlights how backward-looking and out-of-touch the current U.S. President is on this issue.”

He continues: “Cryptocurrencies, such as Bitcoin, are becoming almost universally regarded the future of money.

“Why? Because of the staggering pace of the digitalization of our lives and cryptocurrencies are digital by their very nature.

“They’re also borderless, making them perfectly suited to the world of commerce, trade, and the movement of people.”

He goes on to add: “The serious coronavirus-triggered global recession, like the crash of 2008/2009,  has created a loss of trust in governments, central banks and legacy financial institutions, leaving the door open for the immutable blockchain technology that powers cryptocurrencies.

“In addition, it comes down to demographics. Younger generations, such as Millennials and Gen Z, are digital natives and more likely to hold crypto assets. If demographics are on your side, the future probably is, too.

“Another important indicator is that institutional investors are increasing their exposure to crypto all the time, bringing with them their institutional expertise, clout and capital.”

The deVere CEO concludes: “For the leader of the world’s largest economy to want ‘to go after’ Bitcoin paints him as King Canute trying to turn back the tide.”

About:

deVere Group is one of the world’s largest independent advisors of specialist global financial solutions to international, local mass affluent, and high-net-worth clients.  It has a network of more than 70 offices across the world, over 80,000 clients and $12bn under advisement.

Japanese Candlesticks Analysis 18.06.2020 (EURUSD, USDJPY, EURGBP)

Article By RoboForex.com

EURUSD, “Euro vs. US Dollar”

As we can see in the H4 chart, after completing the pullback close to the support level, EURUSD has formed a Doji pattern. Right now, the pair may start reversing. The downside target remains at 1.1155. At the same time, there is another scenario, which implies that the price may continue trading upwards without testing the support level at 1.1155.

EURUSD
Risk Warning: the result of previous trading operations do not guarantee the same results in the future

USDJPY, “US Dollar vs. Japanese Yen”

As we can see in the H4 chart, after testing the support area again and forming a Hammer pattern, USDJPY is reversing. The current situation implies that the market may resume the ascending tendency towards 107.65. Still, there is an opposite scenario, which says that the instrument may break the support area and continue trading downwards to reach 106.45.

USDJPY
Risk Warning: the result of previous trading operations do not guarantee the same results in the future

EURGBP, “Euro vs. Great Britain Pound”

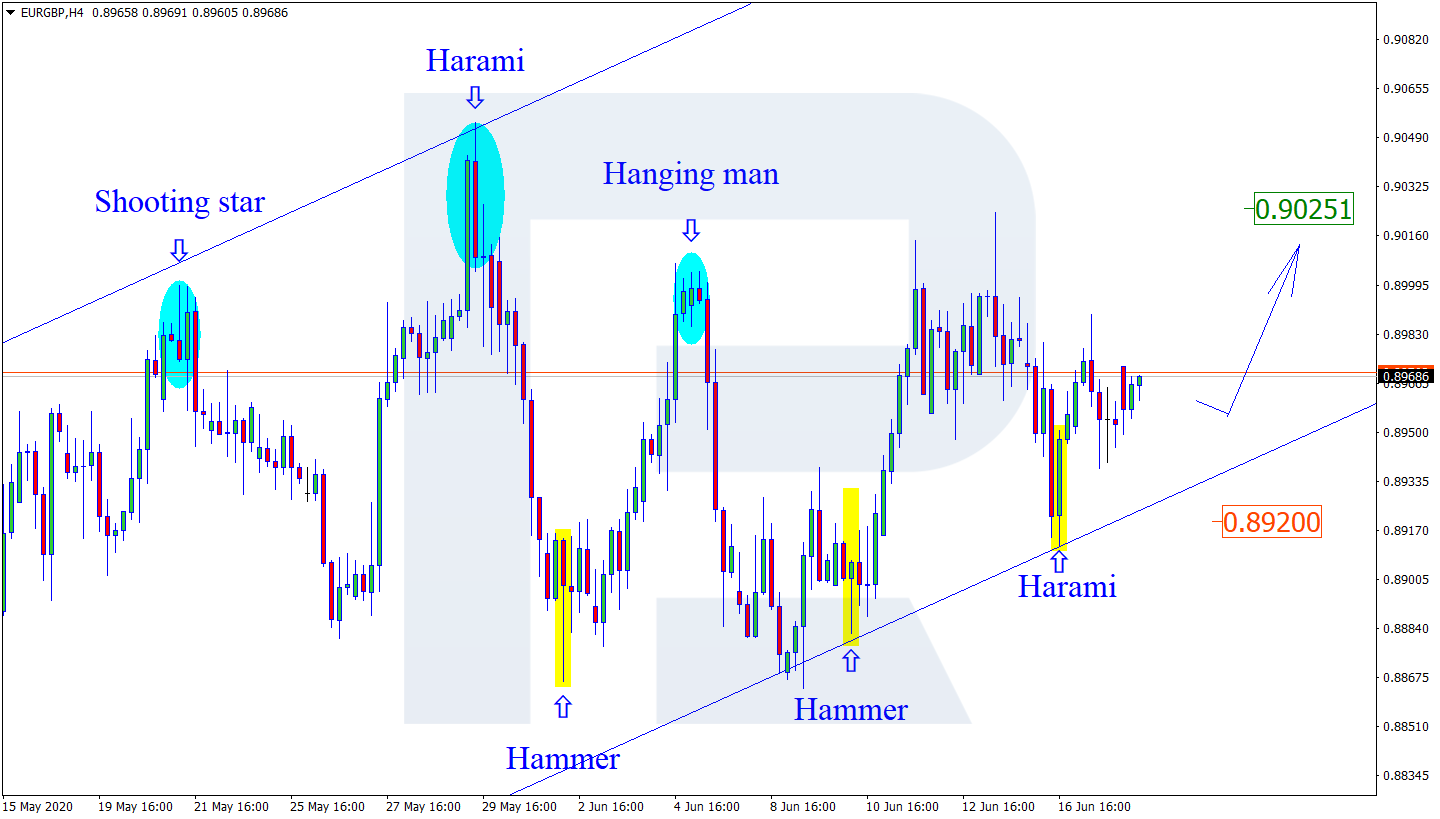
As we can see in the H4 chart, after testing the rising channel’s downside border one more time and forming a Harami pattern, EURGBP is still reversing. The upside target is at 0.9025. After that, the instrument may resume the ascending tendency and update its highs. However, there might be another scenario according to which the instrument may fall and return to 0.8920.

EURGBP

Article By RoboForex.com

Attention!
Forecasts presented in this section only reflect the author’s private opinion and should not be considered as guidance for trading. RoboForex LP bears no responsibility for trading results based on trading recommendations described in these analytical reviews.

Ichimoku Cloud Analysis 18.06.2020 (EURUSD, USDJPY, XAUUSD)

Article By RoboForex.com

EURUSD, “Euro vs US Dollar”

EURUSD is trading at 1.1247; the instrument is moving below Ichimoku Cloud, thus indicating a descending tendency. The markets could indicate that the price may test the cloud’s downside border at 1.1260 and then resume moving downwards to reach 1.1115. Another signal in favor of further downtrend will be a rebound from the descending channel’s upside border. However, the bearish scenario may be canceled if the price breaks the cloud’s upside border and fixes above 1.1305. In this case, the pair may continue growing towards 1.1395.

EURUSD
Risk Warning: the result of previous trading operations do not guarantee the same results in the future

USDJPY, “US Dollar vs Japanese Yen”

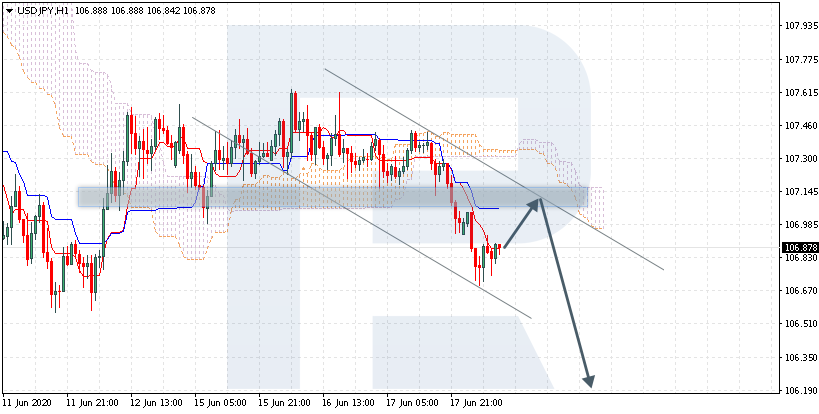
USDJPY is trading at 106.87; the instrument is moving below Ichimoku Cloud, thus indicating a descending tendency. The markets could indicate that the price may test Tenkan-Sen and Kijun-Sen at 107.05 and then resume moving downwards to reach 106.25. Another signal is favor of further downtrend will be a rebound from the descending channel’s upside border. However, the bearish scenario may no longer be valid if the price breaks the cloud’s upside border and fixes above 107.55. In this case, the pair may continue growing towards 108.45.

USDJPY
Risk Warning: the result of previous trading operations do not guarantee the same results in the future

XAUUSD, “Gold vs US Dollar”

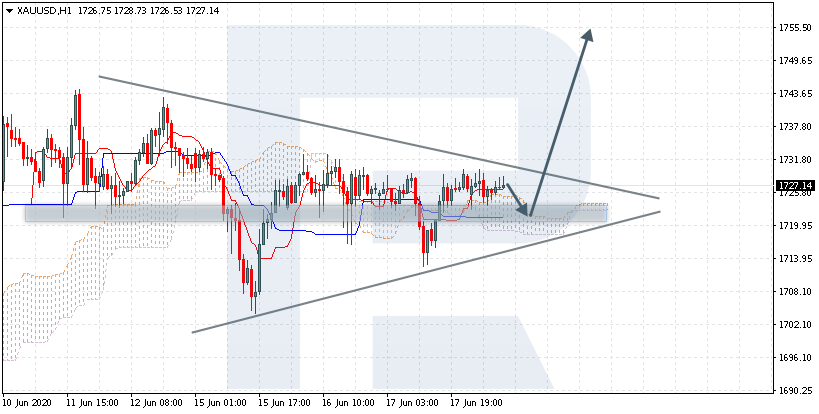
XAUUSD is trading at 1727.00; the instrument is moving above Ichimoku Cloud, thus indicating an ascending tendency. The markets could indicate that the price may test the cloud’s upside border at 1720.00 and then resume moving upwards to reach 1755.00. Another signal in favor of further uptrend will be a rebound from the support level. However, the bullish scenario may no longer be valid if the price breaks the cloud’s downside border and fixes below 1710.00. In this case, the pair may continue falling towards 1675.00. To confirm further growth, the asset must break the upside border of the Triangle pattern and fix above 1735.00.

XAUUSD

Article By RoboForex.com

Attention!
Forecasts presented in this section only reflect the author’s private opinion and should not be considered as guidance for trading. RoboForex LP bears no responsibility for trading results based on trading recommendations described in these analytical reviews.

The Analytical Overview of the Main Currency Pairs on 2020.06.18

by JustForex

The EUR/USD currency pair

Technical indicators of the currency pair:
  • Prev Open: 1.12620
  • Open: 1.12419
  • % chg. over the last day: -0.17
  • Day’s range: 1.12249 – 1.12613
  • 52 wk range: 1.0777 – 1.1494

There is an ambiguous technical pattern on the EUR/USD currency pair. The trading instrument is currently consolidating. The key support and resistance levels are 1.1215 and 1.1265, respectively. The demand for risky assets is still low. Investors are concerned about the growing number of new cases of COVID-19 virus. The number of infected around the world has exceeded 8.3 million. We expect important economic reports from the US. A further drop in EUR/USD quotes is possible. We recommend opening positions from key levels.

The Economic News Feed for 2020.06.18:
  • – Initial jobless claims in the US at 15:30 (GMT+3:00);
  • – Philadelphia Fed manufacturing index at 15:30 (GMT+3:00).
EUR/USD

Indicators do not give accurate signals: the price is consolidating near 50 MA.

The MACD histogram is near the 0 mark.

Stochastic Oscillator is near the overbought zone, the %K line has crossed the %D line. There are no signals at the moment.

Trading recommendations
  • Support levels: 1.1215, 1.1190, 1.1160
  • Resistance levels: 1.1265, 1.1290, 1.1325

If the price fixes below the level of 1.1215, a further fall in EUR/USD quotes is expected. The movement is tending to 1.1180-1.1150.

An alternative could be the growth of the EUR/USD currency pair to 1.1300-1.1340.

The GBP/USD currency pair

Technical indicators of the currency pair:
  • Prev Open: 1.25718
  • Open: 1.25400
  • % chg. over the last day: -0.16
  • Day’s range: 1.25150 – 1.25668
  • 52 wk range: 1.1466 – 1.3516

GBP/USD quotes are consolidating. The technical pattern is ambiguous. Financial market participants have taken a wait-and-see attitude before today’s meeting of the Bank of England. It is expected that the regulator will keep the key marks of monetary policy at the same level. We recommend paying attention to the comments by the Central Bank representatives. At the moment, the local support and resistance levels are 1.2510 and 1.2565, respectively. Positions should be opened from these marks.

At 14:00 (GMT+3:00), the Bank of England will announce its interest rate decision.

GBP/USD

Indicators signal the power of sellers: the price has fixed below 50 MA and 100 MA.

The MACD histogram is in the negative zone, which indicates the development of bearish sentiment.

Stochastic Oscillator is in the neutral zone, the %K line has crossed the %D line. There are no signals at the moment.

Trading recommendations
  • Support levels: 1.2510, 1.2455, 1.2400
  • Resistance levels: 1.2565, 1.2610, 1.2675

If the price fixes below 1.2510, a further drop in GBP/USD quotes is expected. The movement is tending to 1.2460-1.2400.

An alternative could be the growth of the GBP/USD currency pair to 1.2610-1.2650.

The USD/CAD currency pair

Technical indicators of the currency pair:
  • Prev Open: 1.35420
  • Open: 1.35710
  • % chg. over the last day: +0.16
  • Day’s range: 1.35456 – 1.36091
  • 52 wk range: 1.2949 – 1.4668

The USD/CAD currency pair is still being traded in a flat. There is no defined trend. At the moment, the local support and resistance levels are 1.3540 and 1.3615, respectively. Investors expect additional drivers. Economic reports from the United States are in the focus of attention. We also recommend paying attention to the dynamics of oil quotes. Positions should be opened from key levels.

The news feed on Canada’s economy is calm enough.

USD/CAD

Indicators do not give accurate signals: the price has crossed 50 MA.

The MACD histogram is near the 0 mark.

Stochastic Oscillator is in the oversold zone, the %K line has crossed the %D line. There are no signals at the moment.

Trading recommendations
  • Support levels: 1.3540, 1.3510, 1.3455
  • Resistance levels: 1.3615, 1.3680

If the price fixes below 1.3540, USD/CAD quotes are expected to fall. The movement is tending to 1.3500-1.3470.

An alternative could be the growth of the USD/CAD currency pair to 1.3660-1.3690.

The USD/JPY currency pair

Technical indicators of the currency pair:
  • Prev Open: 107.292
  • Open: 107.003
  • % chg. over the last day: -0.31
  • Day’s range: 106.701 – 107.074
  • 52 wk range: 101.19 – 112.41

The technical pattern is still ambiguous on the USD/JPY currency pair. USD/JPY quotes continue to be traded in flat. At the moment, the local support and resistance levels are 106.60 and 107.15, respectively. The demand for “safe-haven” currencies is still high. Today, we recommend paying attention to economic releases, as well as to the dynamics of US government bonds yield. Positions should be opened from key levels.

The news feed on Japan’s economy is calm.

USD/JPY

Indicators do not give accurate signals: the price is consolidating near 50 MA.

The MACD histogram is in the negative zone, but above the signal line, which gives a weak signal to sell USD/JPY.

Stochastic Oscillator is in the overbought zone, the %K line has crossed the %D line. There are no signals at the moment.

Trading recommendations
  • Support levels: 106.60, 106.00
  • Resistance levels: 107.15, 107.65, 108.20

If the price fixes below 106.60, USD/JPY quotes are expected to fall. The movement is tending to the round level of 106.00.

An alternative could be the growth of the USD/JPY currency pair to 107.60-107.90.

by JustForex