Author Archive for InvestMacro – Page 21

The Analytical Overview of the Main Currency Pairs on 2020.06.24

by JustForex

The EUR/USD currency pair

Technical indicators of the currency pair:
  • Prev Open: 1.12612
  • Open: 1.13080
  • % chg. over the last day: +0.43
  • Day’s range: 1.12870 – 1.13250
  • 52 wk range: 1.0777 – 1.1494

The single currency has continued to grow against the greenback. Since the beginning of this week, quotes growth has exceeded 150 points. Yesterday, the euro was supported by optimistic data on economic activity in Germany and the Eurozone. The demand for risky currencies has resumed after comments by White House Trading Adviser Peter Navarro. The official said that the trade deal with China remains in force. At the moment, EUR/USD quotes are consolidating in the range of 1.1285-1.1325. A trading instrument has the potential for further recovery. Positions should be opened from key levels.

The Economic News Feed for 2020.06.24:
  • At 11:00 (GMT+3:00), the German IFO business climate index will be published.
EUR/USD

Indicators signal the power of buyers: the price has fixed above 50 MA and 100 MA.

The MACD histogram is in the positive zone, but below the signal line, which gives a weak signal to buy EUR/USD.

Stochastic Oscillator is in the neutral zone, the %K line is below the %D line, which indicates the bearish sentiment.

Trading recommendations
  • Support levels: 1.1285, 1.1255, 1.1220
  • Resistance levels: 1.1325, 1.1350, 1.1400

If the price fixes above 1.1325, further growth of EUR/USD quotes is expected. The movement is tending to 1.1350-1.1380.

An alternative could be a decrease in the EUR/USD currency pair to 1.1255-1.1220.

The GBP/USD currency pair

Technical indicators of the currency pair:
  • Prev Open: 1.24582
  • Open: 1.25085
  • % chg. over the last day: +0.45
  • Day’s range: 1.24656 – 1.25427
  • 52 wk range: 1.1466 – 1.3516

The GBP/USD currency pair is in a sideways trend. There is no defined trend. GBP/USD quotes are testing the following key support and resistance levels: 1.2450 and 1.2530, respectively. A further increase in the British pound against the US currency is possible. Yesterday, a series of optimistic data on UK economic activity was published, which supports the British pound. Positions should be opened from key levels.

Today, the news feed on the UK economy is calm.

GBP/USD

Indicators do not give accurate signals: the price has crossed 50 MA and 100 MA.

The MACD histogram is in the positive zone, but below the signal line, which gives a weak signal to buy GBP/USD.

Stochastic Oscillator is near the oversold zone, the %K line has crossed the %D line. There are no signals at the moment.

Trading recommendations
  • Support levels: 1.2450, 1.2380, 1.2335
  • Resistance levels: 1.2530, 1.2585, 1.2670

If the price fixes above 1.2530, further growth of GBP/USD quotes is expected. The movement is tending to 1.2580-1.2620.

An alternative could be a decrease in the GBP/USD currency pair to 1.2400-1.2370.

The USD/CAD currency pair

Technical indicators of the currency pair:
  • Prev Open: 1.35198
  • Open: 1.35518
  • % chg. over the last day: +0.19
  • Day’s range: 1.35277 – 1.35832
  • 52 wk range: 1.2949 – 1.4668

The loonie continues to be traded in a prolonged flat. The technical pattern is ambiguous. Financial market participants expect additional drivers. At the moment, the following local support and resistance levels can be distinguished: 1.3530 and 1.3580, respectively. We recommend paying attention to the dynamics of “black gold” prices. Positions should be opened from key levels.

The news feed on Canada’s economy is calm.

USD/CAD

Indicators do not give accurate signals: the price has crossed 50 MA and 100 MA.

The MACD histogram has started rising, which indicates the development of bullish sentiment.

Stochastic Oscillator is in the neutral zone, the %K line has crossed the %D line. There are no signals at the moment.

Trading recommendations
  • Support levels: 1.3530, 1.3490, 1.3455
  • Resistance levels: 1.3580, 1.3625, 1.3680

If the price fixes below 1.3530, USD/CAD quotes are expected to fall. The movement is tending to 1.3490-1.3455.

An alternative could be the growth of the USD/CAD currency pair to 1.3625-1.3650.

The USD/JPY currency pair

Technical indicators of the currency pair:
  • Prev Open: 106.882
  • Open: 106.512
  • % chg. over the last day: -0.34
  • Day’s range: 106.385 – 106.645
  • 52 wk range: 101.19 – 112.41

Yesterday, there were aggressive sales on the USD/JPY currency pair. The trading instrument has overcome and fixed below the key extremes. At the moment, USD/JPY quotes are consolidating. The local support and resistance levels are 106.40 and 106.65, respectively. The technical pattern signals a further decline in the trading instrument. We recommend paying attention to the dynamics of US government bonds yield. Positions should be opened from key levels.

The news feed on Japan’s economy is calm.

USD/JPY

Indicators signal the power of sellers: the price has fixed below 50 MA and 100 MA.

The MACD histogram is in the negative zone, but above the signal line, which gives a weak signal to sell USD/JPY.

Stochastic Oscillator is in the neutral zone, the %K line is below the %D line, which also indicates the bearish sentiment.

Trading recommendations
  • Support levels: 106.40, 106.10, 105.80
  • Resistance levels: 106.65, 106.80, 107.05

If the price fixes below 106.40, a further drop in USD/JPY quotes is expected. The movement is tending to 106.10-105.80.

An alternative could be the growth of the USD/JPY currency pair to 106.90-107.10.

by JustForex

Forex Technical Analysis & Forecast 24.06.2020

Article By RoboForex.com

EURUSD, “Euro vs US Dollar”

After breaking 1.1280 to the upside and then reaching 1.1345, EURUSD has finished the descending impulse at 1.1300 along with the correction towards 1.1325. Possibly, today the pair may form a new descending structure to reach 1.1260 and then resume continue trading upwards with the target at 1.1350.

EURUSD
Risk Warning: the result of previous trading operations do not guarantee the same results in the future

GBPUSD, “Great Britain Pound vs US Dollar”

After expanding the consolidation range up to 1.2540, GBPUSD is trading downwards to reach 1.2420. After that, the instrument may start another growth towards 1.2482, thus forming another consolidation range between the two latter levels. If later the price breaks this range to the downside, the market may resume falling with the target at 1.2277.

GBPUSD
Risk Warning: the result of previous trading operations do not guarantee the same results in the future

USDRUB, “US Dollar vs Russian Ruble”

USDRUB is still falling towards 68.40. After that, the instrument may correct to reach 69.20 and then resume trading downwards with the target at 67.80.

USDRUB
Risk Warning: the result of previous trading operations do not guarantee the same results in the future

USDJPY, “US Dollar vs Japanese Yen”

After finishing the descending wave at 106.06, USDJPY has completed the ascending impulse towards 106.55; right now, it is consolidating around this level. Possibly, the pair may continue growing to reach 106.90 and then fall towards 106.50. Later, the market may resume trading upwards with the target at 107.25.

USDJPY
Risk Warning: the result of previous trading operations do not guarantee the same results in the future

USDCHF, “US Dollar vs Swiss Franc”

After reaching the downside target at 0.9420, USDCHF has completed the ascending impulse towards 0.9453 along with the correction at 0.9435, thus forming a new consolidation range between these two levels. If later the price breaks this range to the upside, the market may resume growing towards 0.9550; if to the downside – form a new descending structure with the target at 0.9419.

USDCHF
Risk Warning: the result of previous trading operations do not guarantee the same results in the future

AUDUSD, “Australian Dollar vs US Dollar”

After completing the ascending wave at 0.6975, AUDUSD has finished the descending impulse towards 0.6923 along with the correction at 0.6960, thus forming a new consolidation range between these two levels. If later the price breaks this range to the upside, the market may form one more ascending structure towards 0.7022; if to the downside – resume trading downwards with the target at 0.6800.

AUDUSD
Risk Warning: the result of previous trading operations do not guarantee the same results in the future

BRENT

Brent has completed the ascending wave towards 43.90; right now, it is falling to reach 41.37. Later, the market may start another growth towards 42.60 and then form a new descending structure with the target at 40.30.

BRENT
Risk Warning: the result of previous trading operations do not guarantee the same results in the future

XAUUSD, “Gold vs US Dollar”

After breaking 1763.00 to the upside, Gold is expected to continue growing towards 1776.20. Later, the market may fall to return to 1763.00 and then form one more ascending structure with the target at 1800.00.

GOLD
Risk Warning: the result of previous trading operations do not guarantee the same results in the future

BTCUSD, “Bitcoin vs US Dollar”

BTCUSD is consolidating around 9600.00. Possibly, the pair may fall towards 9500.00 and then form one more ascending structure to reach 9850.00. After that, the instrument may resume falling inside the downtrend with the target at 9500.00.

BITCOIN
Risk Warning: the result of previous trading operations do not guarantee the same results in the future

S&P 500

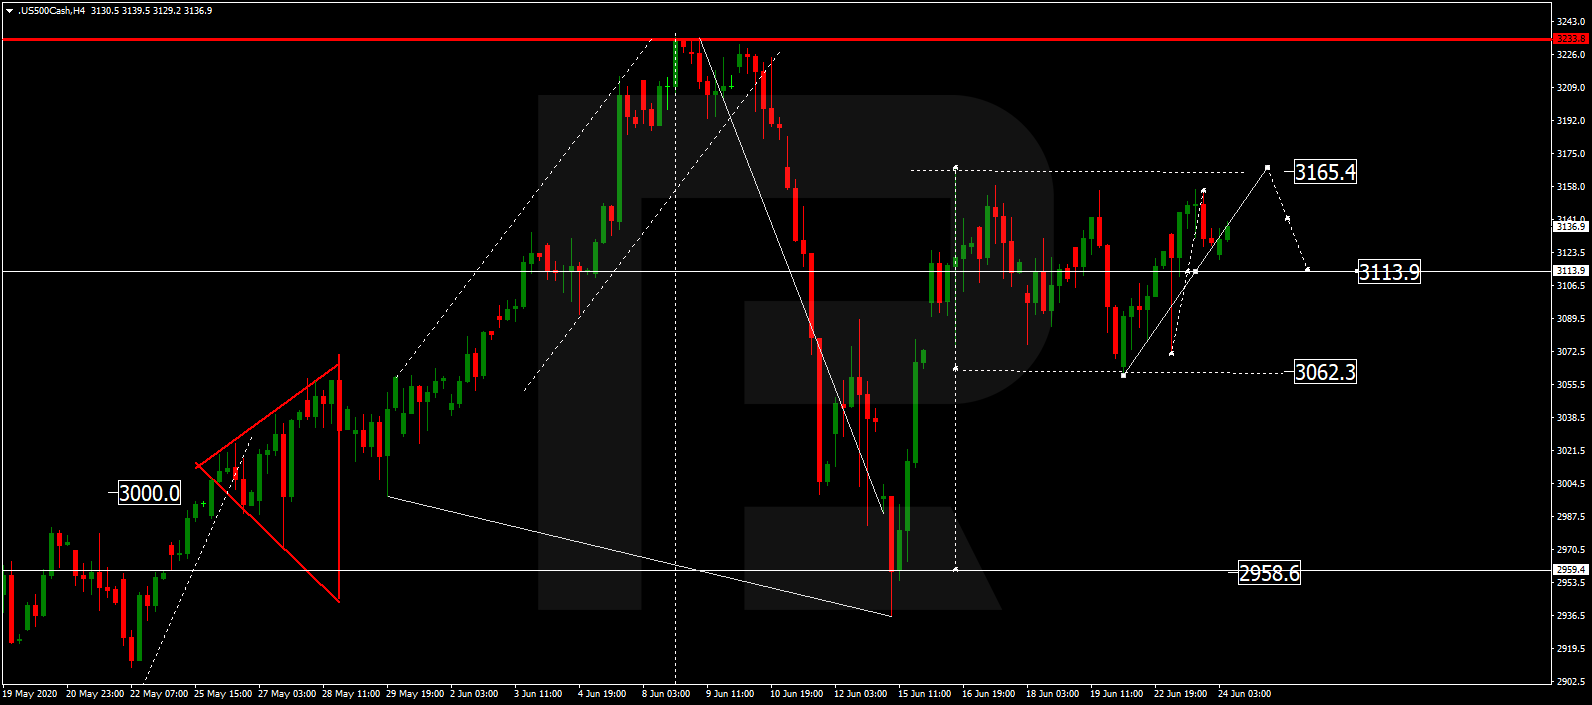
The Index is still consolidating around 3114.0. Possibly, today the pair may grow to reach 3165.5 and then fall to return to 3114.0. If later the price breaks this range to the downside, the market may resume trading downwards to reach 2958.5; if to the upside – form one more ascending structure with the target at 3233.3.

S&P 500

Article By RoboForex.com

Attention!
Forecasts presented in this section only reflect the author’s private opinion and should not be considered as guidance for trading. RoboForex LP bears no responsibility for trading results based on trading recommendations described in these analytical reviews.

The Greenback Has Continued to Lose Ground. RBNZ Has Kept Interest Rate Unchanged

by JustForex

The US currency is declining against currency majors amid growing demand for risky assets. The US dollar index closed in the red zone (-0.39%). In general, investors are counting on economic recovery in the world and have started paying more attention to economic releases. At the same time, the daily increase in the number of cases on COVID-19 continues to impact financial markets negatively.

The single currency is growing after the publication of encouraging economic data. German Manufacturing PMI rose in June and counted to 44.6 instead of 41.5. Markit Composite PMI also rose in June and counted to 47.5 instead of 42.4.

The British pound is growing amid the release of positive news and strong economic data. So, yesterday, Prime Minister Boris Johnson announced that restaurants, cafes, cinemas and hairdressers in England would reopen on July 4. However, several leaders in the healthcare sector still consider such actions to be hasty and are convinced that there is a “real risk” of the second wave of COVID-19 in the UK. A number of optimistic releases on economic activity in the UK support the British pound.

Today, in the Asian trading session, a meeting of the Reserve Bank of New Zealand has been held. During the meeting, the regulator left the key interest rate unchanged at 0.25% per annum.

The “black gold” prices have been declining. At the moment, futures for the WTI crude oil are testing the $39.70 mark per barrel. At 17:30 (GMT+3:00), US crude oil inventories will be published.

Market indicators

Yesterday, there was the bullish sentiment in the US stock market: #SPY (+0.46%), #DIA (+0.45%), #QQQ (+0.85%).

The 10-year US government bonds yield is consolidating. At the moment, the indicator is at the level of 0.70-0.71%.

The news feed on 2020.06.24:
  • At 11:00 (GMT+3:00), the German IFO business climate index will be published.

by JustForex

Fibonacci Retracements Analysis 24.06.2020 (GBPUSD, EURJPY)

Article By RoboForex.com

GBPUSD, “Great Britain Pound vs US Dollar”

As we can see in the H4 chart, GBPUSD is starting a correction to the downside after the divergence. After reaching 23.6% fibo, the first descending impulse tried to reach 38.2% fibo at 1.2276 but started an internal pullback to the upside instead. Possibly, the market may resume falling towards 50.0% and 61.8% fibo at 1.2111 and 1.1946 respectively. The resistance is the high at 1.2813. If the price breaks this level, the instrument may resume the long-term uptrend.

GBPUSD_H4
Risk Warning: the result of previous trading operations do not guarantee the same results in the future

The H1 chart shows a short-term rising pullback after the descending wave, which has already reached 50.0% fibo and may yet continue towards 61.8% fibo at 1.2553. After finishing the pullback, the pair resume trading downwards to break the low at 1.2335 and then continue towards the mid-term 38.2% fibo at 1.2276.

GBPUSD_H1
Risk Warning: the result of previous trading operations do not guarantee the same results in the future

EURJPY, “Euro vs. Japanese Yen”

As we can see in the H4 chart, EURJPY is correcting to the downside; it has already reached 50.0% fibo and may continue falling towards 61.8% fibo at 118.79. at the moment, the pair is forming a short-term rising structure within the correction. After finishing the pullback, the instrument may start a new rising wave towards the mid-term 50.0% fibo at 125.94 but only after breaking the high at 124.43.

EURJPY_H4
Risk Warning: the result of previous trading operations do not guarantee the same results in the future

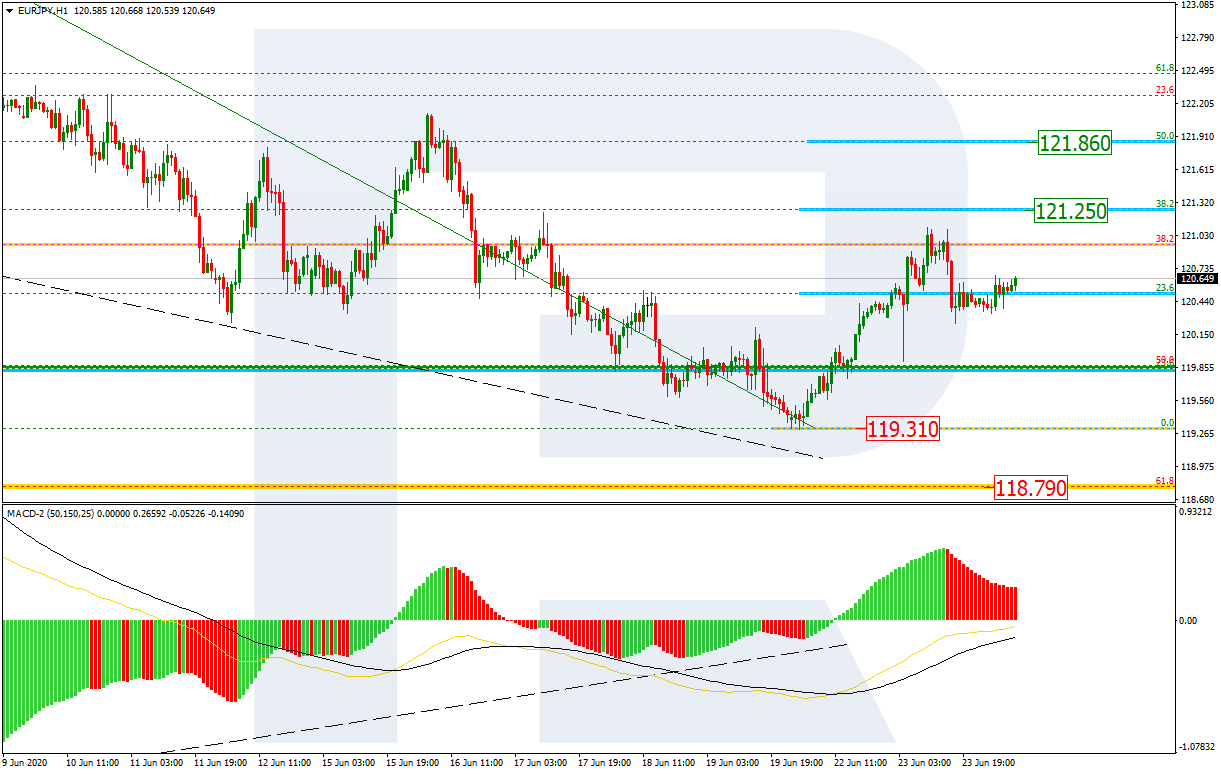
The H1 chart shows a more detailed structure of the correctional uptrend after the descending wave and the convergence. After reaching 38.2% fibo at 121.25, the first ascending impulse has failed to test it. Possibly, the pair may yet test this level and break it to continue growing towards 50.0% fibo at 121.86. However, if the price breaks the low at 119.31, it may resume the descending tendency.

EURJPY_H1

Article By RoboForex.com

Attention!
Forecasts presented in this section only reflect the author’s private opinion and should not be considered as guidance for trading. RoboForex LP bears no responsibility for trading results based on trading recommendations described in these analytical reviews.

More stimulus on the way? Investors bolster portfolios

By George Prior

Investors are now moving to buy stocks to bolster their portfolios ahead of yet more stimulus from the U.S. Congress and Federal Reserve which will further drive-up prices, affirms the CEO of one of the world’s largest independent financial advisory and fintech organizations.

The comments from Nigel Green, chief executive and founder of deVere Group, come as the White House is pushing for stimulus checks, which perhaps could come as early as next month.

In addition, it is widely expected the Fed will extend its unprecedented array of stimulus measures.

Mr Green notes: “Financial markets that were rattled by a coronavirus-triggered panic three months ago have since the end of March been on an impressively strong upward trajectory.

“This has been driven largely by the historic levels of stimulus.”

He continues: “It is likely the world’s largest economy, the U.S, will receive another round of stimulus shots in the near-future.

“As before, this will serve to further boost asset prices.

“Knowing this, savvy investors are, perhaps unsurprisingly, moving now to buy high quality stocks to bolster their portfolios ahead of the next announcements.”

After the Fed’s last expansion to its already record-beating stimulus programme on June 16, the deVere CEO said: ““This extra stimulus acts as a ‘backstop’ or ‘floor’ for equities.

“The additional Fed support was widely expected by the markets and therefore, investors who have been paying attention have been topping-up their investment portfolios recently as entry points will inevitably continue to go higher as we move forward.”

Mr Green goes on to say: “The campaign by the Fed to support markets has worked incredibly well. So much so, that there will be influential voices calling for them to put a break on further stimulus after the likely, and highly anticipated, next round.

“This factor too can be expected to drive investors to seek the opportunities. Few things can fuel markets like another stimulus injection, so if this potential next round is one of the last for a while, investors will not want to miss the boat.”

He concludes: “Clearly, not all shares are created equal and a good fund manager will help investors seek those most likely to generate and build their wealth over the long-term.”

About:

deVere Group is one of the world’s largest independent advisors of specialist global financial solutions to international, local mass affluent, and high-net-worth clients.  It has a network of more than 70 offices across the world, over 80,000 clients and $12bn under advisement.


US Stock Market Enters Parabolic Price Move – Be Prepared, Part I

By TheTechnicalTraders 

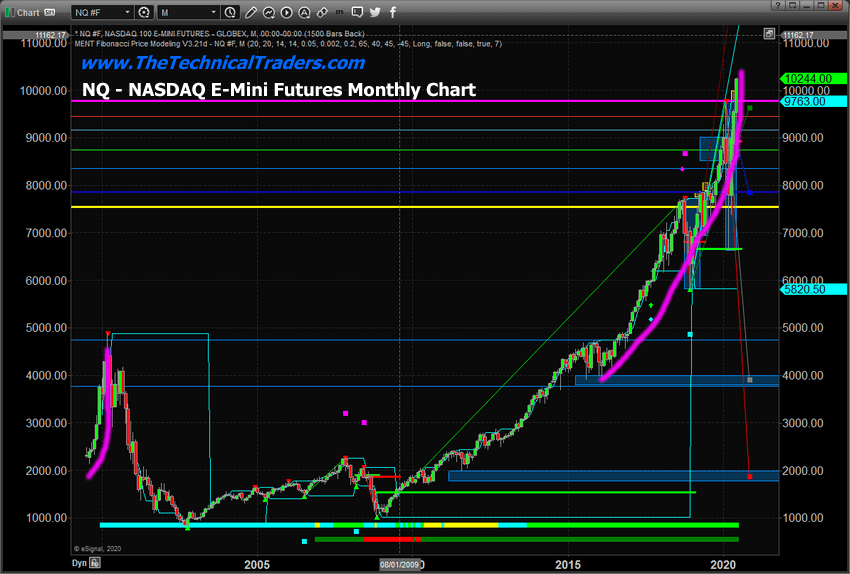
– After the recent COVID-19 virus event and the global market concerns that will warrant caution for skilled traders and investors, the US stock markets have entered an upside parabolic trend that will likely end with a massive price collapse – extremely volatile and aggressive in nature.  Our research team continues to warn of the unpredictable nature of the current price rally and the fact that the upside parabolic price trend appears more prominent in the NASDAQ sector.  If history has taught us anything, it is that these types of parabolic moves can last a while and that they always end in a deep downside price correction – usually 61% to 75% of the last upside price trend.

Our research and trading team has been advising friends and followers to stay very cautious of the current markets (excluding Gold, Miners, and certain other protective sectors).  We don’t believe this rally warrants any exposure greater than 15 to 20% given the current global economic environment and the hyper-parabolic nature of the current price move.  We believe the opportunity presented by the upside advances does not negate the potential risks of a massive collapse event taking place in the near future.  In other words, we’re more cautious of how ugly and aggressive the end of this parabolic move will be than willing to try to find some opportunities in an already hyper-extended parabolic upside price trend.

Still, there are opportunities to be had in this trend for skilled short-term technical traders.  A number of sectors continue to perform quite well and using proper position sizing for trades may allow for quick targets of 5% to 10% or more.  We urge all of our friends and followers to be cautious of the current rally in the markets as we’ve only seen this happen three other times over the past 100 years: 1927~29, 1986~87, 1996~99.  The collapse after the 1929 peak resulted in a 90% decline in prices.  After 1987, the markets collapsed by nearly 36%.  After the DOT COM market peak in 1999, the markets collapsed near 51%.  Are the markets preparing for a massive collapse event right now with this hyper-parabolic upside price trend?

NASDAQ MONTHLY CHARTS

This monthly NQ, NASDAQ E-Mini Futures, chart highlights the upside parabolic price move that is currently taking place.  It also highlights the similar type of price movement that took place in the late 1990s.  In theory, the buying power driving the markets higher can last more than 12 to 15 months in some cases.  Prior to the peak in 1929, the parabolic move started near June 1926 and peaked in July 1929 – approximately 3 years.  In 1986, the rally in price was shorter – only lasting from November 1985 to August 1987 – about 21 months.  The rally to the DOT COM peak in 1999 started near March 1995 and lasted a total of approximately 51 months (just over 5 years).

The current rally, as we identify the start of the parabolic price trend, started after the 2015~16 sideways price range.  Our research team considers the start of this current upside move as initiating near July 2016 and continuing through to today – totaling almost 4 years in length.  If we discount the 2015~16 sideways price channel and consider the 2012 to 2020 Fed-induced price rally as the “total scope” of the parabolic range, then we can easily total more than 7 years into this incredible parabolic price move.  This move is truly unlike anything we’ve seen in the recent history of the US stock market – and the crazy component to all of this is it is happening at a time when the global markets have just been derailed by a global virus pandemic.

What comes next?  Well, if history is any teacher – a peak in price sets up, volatility starts to explode and a collapse in price initiates at some point in the future that completely deflates the bubble.

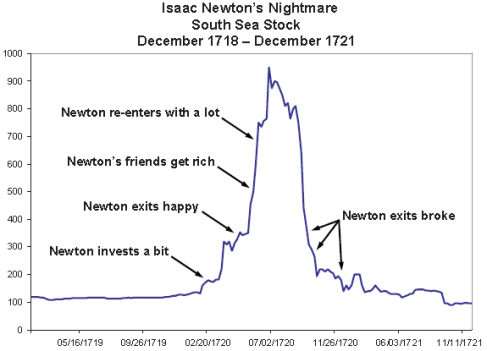
The most prominent example of a price bubble that many traders are familiar with is the story of the South Sea Company (1719 to 1721).  Prior to the peak in this bubble story, the South Sea Company began as an act of English Parliament (source: https://engl3164.wordpress.com/2012/10/31/the-south-sea-bubble/ ).  As stated from our source…

At this time, the English government was deeply in debt.  Harley, the Earl of Oxford, came up with a scheme to free England of this debt while capitalizing on what was perceived as a largely untapped gold and silver market in South America.  Harley proposed that Parliament could create an independent company that would assume all of England’s debt and, in exchange, would be able to charge the government yearly interest until the original sum was repaid.  The company would be able to afford to assume this debt because England would grant it a monopoly on trade from South America.  The company would prosper, English influence would be extended further into the New World, and the English government would become free of debt.  This plan was so popular that it was called “the earl of Oxford’s masterpiece” (Carswell, 1969).

            It took several years to form the company and work out the details of the agreement.  By 1720, the South Seas Company was formed and received £30,981,712 in debt from the English government in exchange for a promise that the English government would pay £600,000 per year interest.  However, the plan had already begun to show major weaknesses, even before taking on this huge debt.  The success of the plan rested on the assumption that a monopoly on English trade with Latin America was worth almost limitless profit.  Certainly, Spain was enjoying great profit in extracting gold and silver from this area.  Yet a major problem was that Spain owned the rights to South American trade and would allow England only one ship’s worth of trade per year for the entire continent and only on the condition England pay 25% of the profits to Spain in addition to a 5% tax.  Even this small concession ceased entirely in 1718 when England declared war on Spain (Carswell, 1969).

We want all of our readers to understand the psychological aspect of this past bubble – the idea that the plan could not fail and would provide almost limitless success if executed as planned set off a “no fear rally” that eventually resulted in a massive price bubble.

The next major point that is critical to the understanding of how a price bubble function is the following statement from the same source…

Regardless of the fact that the South Seas company was an unproven company already sunk deeply in debt, with no realistic prospects of profit, it was perceived as an almost infallible opportunity.  As with all economic bubbles, the public’s perception of its potential was far greater than its actual value.  For this reason, stock prices soared.  Modern economists have argued that some investors may have been fully aware that this was an artificial market that was bound to fail.  However, realizing that stock prices would continue to climb until the bubble burst, it would still have been profitable to buy stock with the intention of selling before prices inevitably plummeted (Temmin and Voth, 2003).

What could go wrong with this plan for investors?  It seemed as if nothing could fail – there was almost no risk and everyone had incredibly high expectations of future success and profits…  Then, more good news for traders and investors..  More shell companies promising future greatness to continue to hype the markets…

Unfortunately, investors in the South Seas Company were not the only individuals to lose money during this time.  Many businessmen, realizing the potential for profit in such an artificial market, began similar schemes to create companies with inflated stock prices.  Hundreds of companies were formed within only a few months, with thousands of individuals rushing to buy stock.  Ultimately, these companies went the way of the South Sea Company.  Countless investors lost fortunes while many dishonest market speculators became rich (Carswell, 1969).

(Source: https://engl3164.wordpress.com/2012/10/31/the-south-sea-bubble/ )

Eventually, when reality set back into the minds of these investors, many had lost entire fortunes, families, and futures.  Some of these company founders were hunted down and killed because of the anger and frustration of many investors and others.  The reality of the situation is that nothing is without risk – just like the stock market valuations today.

Before you continue, be sure to opt-in to our free market trend signals before closing this page, so you don’t miss our next special report!

In the second part of this research article, we’ll continue to explore the potential price bubble that is setting up in the US and global stock markets as a result of the US Fed and global central banks pushing speculative investments into the global equities markets (primarily the US stock market).  It is essential that all skilled traders and investors learn to understand what is happening and to understand the severe risks that are currently in play in the markets right now.  Stay cautious, stay protected, and stay safe.

Get our Active ETF Swing Trade Signals or if you have any type of retirement account and are looking for signals when to own equities, bonds, or cash, be sure to become a member of my Passive Long-Term ETF Investing Signals which we are about to issue a new signal for subscribers.

Chris Vermeulen
Chief Market Strategies
Founder of Technical Traders Ltd.

TheTechnicalTraders.com


Your emotions are the new hot commodity – and there’s an app for that

By Anna Rudkovska, Western University and Danica Facca, Western University

Emotions are the newest hot commodity, and we can’t get enough.

Since the beginning of the COVID-19 pandemic, we’ve come to rely even more on our digital devices, including to help manage our emotions.

There are approximately 2.57 million apps available for Android users to download and approximately 1.84 million apps available for Apple users. Apps are those tools on our phones or tablets which help us monitor, record and regulate some of the most intimate aspects of our lives, from sleep and menstrual cycles, to food intake and finances.

Many of the most popular apps in the West include the goal of self-improvement, which seems to be a constant drive for many.

The investment of our time and money into apps that help us become better performers, managers and producers is one of the consequences of neoliberalism, the idea that humans can make progress in their lives through market competition and economic growth.

Neoliberalism empasizes individualism, economic efficiency, low to no government interference and generally ignores systemic issues.

Under neoliberalism, a person is an enterprise whose personality traits and skills are considered valuable assets that need continuous management, improvement and investment.

Apps can help with the business of us: we can easily track and monitor our bodies with workout classes, diets and skill-building exercises. As we track our progress in apps, we can literally visualize our bodies and capabilities improve.

Emotions, however, are trickier. We haven’t had the same kind of metric tools and assessment criteria to track our minds to the same degree we can track our bodies caloric intake or waist circumference.

Enter mood tracking apps.

The simultaneous production and consumption of emotion, or emotional prosumption manufactures emotion for consumer consumption.

The pursuit of happiness

Mood tracking apps are sophisticated tools which promise the ability to track, measure and improve our emotions. Positive emotions, like happiness, are encouraged through visual features like “best day streaks.”

Negative emotions like sadness or anger are dissected with aims to avoid or erase their existence.

In this new emotional frontier, happiness is the bar against which we measure all other emotions. The very existence of mood tracking apps is a testament to this.

Many of the most popular apps are about self-improvement.
(Thúy Lâm/Unsplash)

The potential to improve our emotional traits and skills through apps appears limitless. While there is nothing wrong with pursuing a more fulfilling emotional life, there is a danger in being blinded by the quest for happiness. Since mood tracking apps are designed to direct us solely toward happiness, will we be prevented from understanding and engaging with the true complexity of our emotions?

Data dangers

By reducing our experiences, bodies and emotions to numbers, or quantified data, we make them ripe for consumption by app developers and interested third parties.

As a critical health researcher and a digital health literacy researcher, we are both concerned with how unsuspecting users may be taken advantage of within this frontier of continual self-improvement, especially if their personal data falls into the wrong hands and manipulated against them.

When it comes to commerce, emotions are powerful. They have the ability to move us towards action, change our minds and foster new relationships. They are also fast and reactive. Making decisions becomes more challenging when choices are everywhere and need to be made at lightning speed.

Modern advertising, by design, targets this impulsivity by hooking us on products and content through emotion.

Emotional data leaves us vulnerable to manipulation by corporations and political parties.
(Marcus P./Unsplash)

In his book, Psychopolitics, Neoliberalism and New Technologies of Power, cultural theorist Byung- Chul Han discusses how this shift signals a creation of emotional consumption. We no longer buy a phone because it’s a good phone, but rather because the ad displays happy people surrounded by friends using that phone.

We are drawn to ads and marketing campaigns because of the way they make us feel rather than the service they provide.

In a similar vein, social media platforms like Instagram, Tinder and Facebook hook us by “selling” us “likes,” matches and affirmation through numbers. Since likes and swipes take less than a second to perform, they target and rely on the reactive nature of emotion.

The consumption of emotions

Emotions then become a new commodity that we knowingly or unknowingly produce and are for sale to the highest bidder. This is known as emotional prosumption.

Emotional prosumption produces two consequences. First, due to the reactivity of emotions, our decision making can be swayed when the information we consume is emotionally charged.

As such, in 2016, the emotions of voters in the United States were taken advantage of and manipulated through specifically targeted ad campaigns. Specifically, emotionally charged ads pertaining to immigration, gun laws and other political issues were deliberate targeted at the U.S. electorate just days before the election.

Our emotional data can be sold to third parties without our permission. Likes, swipes and mood tracking logs can all be classified as emotional data and provide companies with information on how to promote products to us in ways that trigger the highest emotional response.

These abilities raise questions not only for data privacy, but also for advertising ethics.

The unregulated creation and consumption of emotional data is therefore problematic for two reasons: It places emphasis on “positive” emotions rather than a healthy spectrum, and it takes information about immaterial consumption without user knowledge.

The ethical implications of emotional prosumption may leave a lasting impact on how we advertise, how and what we consume, and what aspects of ourselves we are willing to alter in the never ending quest of personal optimization.The Conversation

About the Author:

Anna Rudkovska, PhD Candidate, School of Health and Rehabilitation Sciences, Western University and Danica Facca, PhD student, Health Information Science, Western University

This article is republished from The Conversation under a Creative Commons license. Read the original article.


Semiconductors and AMD Close To A Breakout Move

By TheTechnicalTraders 

– Being a technical trader means we attempt to identify opportunities in and market, symbol, or sector based on technical indicators, price patterns, advanced price theory/modeling, and much more.  We don’t particularly care if the opportunity is a bullish breakout rally or a bearish breakdown selloff, we simply want to find the “setups” that create this opportunity because that is our “sweet spot”.  That is where the technical trader lives for the excitement of being able to find these technical setups and potential trade them for profits/success.

AMD Cup & Handle/Pennant Daily Chart

Let me teach you about two price patterns that are currently setting up in Advanced Micro Devices (AMD) where we can attempt to illustrate how a combination of technical triggers may align to present a very clear opportunity for technical traders.

This chart highlights a Cup & Handle pattern and a Bullish Pennant/Flag pattern.  Ideally, the combination of these two patterns would suggest a higher probability of an upside bullish breakout rally beginning near the apex of the Pennant formation. Yet, Pennant formations, and other types of technical patterns, can often present a “Washout sell-off in price” near the apex (or breakout area) as a means of shaking out stops before entering the next leg of the trend.

The “Washout” move happens as price tightens into a narrowing price channel and nears the end of a Pennant/Flag formation pattern. This typically results in a broader price move against the predicted technical pattern trend, in this case, down.  What happens is that traders tend to set stop levels just outside the tightening price channels as a means to protect against a price breakdown or rally against their position.  These stop orders present very real volatility targets when price begins the Apex breakout/breakdown event.  The price will usually rotate against the primary technical trend for a short period of time, taking out many stops in the process, then stall and begin to move in the direction of the technical pattern predicted trend, which would be a rally towards $72.

In this case with AMD, the Apex breakout move (to the upside) may be preceded by a price breakdown move near, or below, the $48 to $49 level – this is the “washout” move.  We’ve highlighted what we believe is the lower technical support level in AMD near $44.  This would represent a moderately deep downside price “washout” target level for skilled technical traders.  After this potential washout trend completes, a broader upside price trend usually sets us prompting a rally towards the original Pennant/Flag targets and likely completing the Cup & Handle pattern breakout.

The combination of the Cup & Handle pattern with the Bullish Pennant price pattern in AMD presents a very real opportunity for skilled technical traders.  If your risk tolerance for the trade is capable of riding out the potential “washout low”, then you may consider setting your long entry trades just below the $48 to $50 levels as we near the true Apex event of this trade setup.  There is no guarantee that the washout event will move down to the lower $44 support level – so consider that level a deeper price support level representing a deeper downside price washout.

Ideally, the pending Apex event of the Cup & Handle pattern and the Pennant pattern will result in a moderate 8% to 15% price washout move before the upside price trend initiates.  This suggests that the washout rotation may end near $48 or $49, where price may find support, then begin to rally higher.  The Breakdown Support level on this chart should be considered a “failure level” for this bullish price pattern.  If the price moves below that level when it initiates the Apex volatility, then it is very likely that support has broken down and the predicted upside price trend has failed.

This is how technical traders approach many types of technical price triggers.  We have an expected outcome for price and trends.  We understand the volatility factors related to the trade triggers and we attempt to identify risk factors and profit capabilities before we execute any trades.  If these parameters for our traders are adequate, then we may decide to execute the trade attempting to capture the profits.

Before you continue, be sure to opt-in to our free market trend signals before closing this page, so you don’t miss our next special report!

Get ready, this AMD trade setup is nearing the Apex moment and our research team believes a $48 to $50 entry price range is an adequate “washout” range with minor risk factors.  Upside price targets should start near $61.50 and $69.  If you understand how to execute the trade properly, we’ve just delivered a complete blueprint for a potential Apex Breakout trade in AMD using simple technical analysis. This is the basic view of what we offer the active followers of our swing trade alert newsletter. Ride my coattails as I navigate these financial markets and build wealth one chart pattern at a time.

As a technical analyst and trader since 1997, I have been through a few bull/bear market cycles in stocks and commodities. I believe I have a good pulse on the market and timing key turning points for investing and short-term swing traders. Make 2020 and beyond incredibly profitable by following my analysis and trade alerts.

Get my Active ETF Swing Trading Newsletter or if you have any type of retirement account and are looking for signals when to own equities, bonds, or cash, be sure to become a member of my Passive Long-Term ETF Investing Signals which we are about to issue a new signal for subscribers.

Chris Vermeulen
Chief Market Strategies
Founder of Technical Traders Ltd.


U.S. Long Bond: Let’s Review the “Upward Point of Exhaustion”

By Elliott Wave International

– Here’s an update on the trend of 30-year U.S. Treasuries since the historic early March price moves

Back in early March, the behavior of the bond market was reminiscent of what unfolded during the depths of the 2007-2009 financial crisis.

Prices and yields were making major moves in a short period of time.

On March 5, the U.S. Treasury long bond closed at 173^30.0. The very next day, on March 6, the long bond rallied to 180^19.0, a whopping 6+point move, reaching a new all-time high.

But the rally had more to go.

On March 9, Elliott Wave International’s U.S Short Term Update, a publication which provides near-term forecasts for major U.S. financial markets three times a week, showed this chart and said:

The moves in bond prices and yields are historic. The yield on 30-year US T-bonds dropped to 0.6987% intraday. At the close, 30-year yields barely had a 1% handle. The [U.S. Treasury long bond] spiked to 191^22.0 and the DSI Indicator (trade-futures.com) is at 98% bond bulls. Prices surged through the … trendline but then pulled back to close right on it. Might this be the point of upward exhaustion? In just two days, prices have rallied 21 points. Junk-to-U.S. treasury spreads have surged to 550 basis points, the widest since July 2016.

As it turned out, on that very day, U.S. long bond prices did reach “the point of upward exhaustion.”

Here’s what’s happened since. This chart is from the June 5 U.S. Short Term Update, which noted that March 9 high and said:

[U.S. Treasury long bond futures] are working their way down. … Market moves are never a straight line, but the decline is developing impulsively.

Many investors “diversify” into bonds to shield themselves from the volatility of the stock market.

However, market participants can lose just as big in the bond market.

The U.S. Short Term Update identifies price targets, which are in accordance with the long bond’s Elliott wave structure.

As Frost & Prechter’s Elliott Wave Principle: Key to Market Behavior notes:

It is our practice to try to determine in advance where the next move will likely take the market. One advantage of setting a target is that it gives a sort of backdrop against which to monitor the market’s actual path.

The Wave Principle can be applied to bonds, as well as stocks, gold, currencies and other widely traded markets.

If you’d like to learn more about the Wave Principle, you can access the online version of Elliott Wave Principle: Key to Market Behavior, free.

All that’s required is a free Club EWI membership. Club EWI is the largest Elliott wave educational community in the world.

Follow this link to get started: Elliott Wave Principle: Key to Market Behavior, free access.

This article was syndicated by Elliott Wave International and was originally published under the headline U.S. Long Bond: Let’s Review the “Upward Point of Exhaustion”. EWI is the world’s largest market forecasting firm. Its staff of full-time analysts led by Chartered Market Technician Robert Prechter provides 24-hour-a-day market analysis to institutional and private investors around the world.

Hainan’s ASEAN future and dark clouds over Hong Kong

By Dan Steinbock

– The Hainan Free Trade Port plan is aligned with China’s new Silk Road initiatives, the Greater Bay Area plan and deeper ties with Southeast Asia. Hong Kong’s real threats are closer and farther.

On June 1, the Chinese government published its Hainan masterplan. It seeks to transform the southernmost province, separated from Guangdong’s Peninsula by the Qiongzhou Strait, into a Free Trade Port (FTP). The plan will turn China’s largest and most populous island to its biggest special economic zone (SEZ).

The initiative stems from the early days of Chinese economic reforms. Following the first special economic zones in Guangdong and the opening of further 14 coastal megacities to overseas investment, the government disclosed its plan to transform Hainan into China’s largest SEZ in 1988.

In the West, Hainan’s long-term plan has been seen as a reaction to recent turmoil in Hong Kong and the Trump administration’s controversial trade war against China.

In reality, Hong Kong’s real threats are elsewhere.

Vital link to ASEAN and 21st Century

Maritime Silk Road

In Hainan, things began to change in 2009, when the Chinese government began to transform the island into an international tourist destination by the early 2020s. As investment inflows intensified, particularly in real estate, another surge ensued in the early 2010s, when Hainan came to be seen as a frontline to Southeast Asia, and as a vital node in the Maritime Silk Road along the Belt and Road Initiatives.

Due to new protectionism in the West, that role has steadily increased in importance. In early 2020, the rising bilateral trade with ASEAN accounted for 15% of China’s total trade volume, relative to 11% and 14% with the US and EU, respectively.

With its proximity to Southeast Asia, Hainan possesses unique advantages as a future free trade port. With more than 9 million people, it is a fourth more populous than Hong Kong and almost twice as big as Singapore. And by land area – 35,000 km2 – it is more than 30 times the size of Hong Kong (and nearly 50 times larger than Singapore). That’s vital for an international trade hub.

According to the four-stage timeline, Hainan should become an operational free trade zone during this year. In 2020-25, Hainan’s free trade port should be in place, with an attractive business environment, improved industrial competitiveness, sound rule and law. In 2025-35, the FTP is expected to mature operationally. And by 2050, Hainan should have established, strong international influence.

The Hainan masterplan seeks to liberalize cross-border flows of trade, investment and capital, and people, transport and data. But its current positioning and industry focus are different from Hong Kong.

Hainan will play more of a complementary role – not a competitive rivalry – to Hong Kong.

Dark clouds over

Hong Kong’s future

Under the 1992 “US-Hong Kong Special Policy Act” and after the 1997 handover of Hong Kong from Britain to China, Washington has treated the city separately from the mainland in matters of trade exports and economic control.

In the past two decades, there have been periodic attempts by mainly localist and separatist groups in Hong Kong to undermine the status quo. In the West, they are seen as “pro-democracy” groups, whereas China sees them as destabilizing forces, due to their close cooperation with regime-change forces in the US and UK.

These efforts intensified in summer 2019, which saw a violent protest escalation that undermined Hong Kong’s recovery, pushed it to recession even before the pandemic and has contributed to the city’s current, first-ever back-to-back recession.

At the same time, cooperation between some protest leaders and US Congress led to an amendment in the 1992 Act. The 2019 “Hong Kong Human Rights and Democracy Act” allows US government to impose sanctions against Chinese and Hong Kong officials and requires US agencies to conduct an annual review to determine whether changes in the US-Hong Kong trade relations are warranted.

In Beijing’s view, such a law would be comparable to a Chinese Act that would allow China to conduct reviews and impose sanctions against US government, state and municipal officials depending on, say, the dire state of race relations in America.

Nonetheless, in late May, US Secretary of State Mike Pompeo certified to Congress that Hong Kong no longer enjoys a high degree of autonomy from China. Days later, President Trump announced some sanctions would be placed on Hong Kong.

With these statements, the White House has paved a potential way to bad business, diplomacy, precedent and still another major policy mistake.

How 2019 Act would undermine

American multinationals and Hong Kong

Today, there are some 85,000 US citizens in Hong Kong, which hosts 1,300 US companies with Asian headquarters in the city. If the new 2019 Act is implemented, they could leave for Singapore or elsewhere, which would penalize their cost structure, or relocate to China, which would undermine the White House’s objectives. In both cases, US would lose its bilateral goods and service trade surplus of $34 billion with Hong Kong, which would cost still more US domestic jobs.

The long-term diplomatic impact could be worse. For decades, US presence in Hong Kong has been a major influence channel in East Asia, while US multinationals’ HQs in Hong Kong and their subsidiaries in China have served as vital instruments of increasing bilateral understanding. Yet, the Trump White House seems intent to undermine both.

Since the 2019 Act could derail Hong Kong’s economic and political future, it represents everything but the best interests of the city. That’s perhaps why some leading Hong Kong protesters have recently, but only belatedly, warned about the consequences of the Act that they themselves had made possible.

The Trump White House’s policy mistake could also trigger a process in which Shanghai, thanks to its Free Trade Zone and Lingang New Area, could receive many new US companies, particularly financial giants, that the 2019 Act would force to leave Hong Kong. Since 2009, Shanghai has been transformed into the mainland’s global financial and trade hub. Those steps would certainly be accelerated.

And thanks to the Greater Bay Area initiative – China’s huge Silicon Valley-like region that links Guangdong’s megacities, Hong Kong and Macau – US technology giants could flock to Shenzhen and elsewhere, while those that operate in Southeast Asia or have significant shipping interests could move to Hainan.

The greatest threat

to Hong Kong

Hong Kong’s greatest threat has never been the myth that China would want to turn it into “just another Chinese city.” That’s precisely the one thing China does not want.

Instead, Hong Kong’s greatest risk is irrelevance. If its greatest strengths are undermined, it could become inconsequential as a major global economic hub.

Indeed, if the White House prevents the city from realizing its unique advantages – world-class finance, shipping and trade – Hong Kong would face accelerated decay in the future.

Hainan’s free port is not Hong Kong’s threat. The city’s real risks are closer and farther.

About the Author:

Dr. Dan Steinbock is an internationally recognized strategist of the multipolar world and the founder of Difference Group. He has served at the India, China and America Institute (USA), Shanghai Institutes for International Studies (China) and the EU Center (Singapore). For more, see https://www.differencegroup.net

A shorter version of the commentary was released by China Daily on June 19, 2020