Author Archive for InvestMacro – Page 20

Europe’s Banking Sector: When (and Why) the Rout Really Began

By Elliott Wave International

– The financial sector has been one of the global stock market’s bedrocks for decades. That’s why its performance is so critical to the overall stock market health.

Well, here’s a chart of the European Stoxx 600 Banks Index over the past four years.

Not pretty, we know.

Now let’s zoom in on the price action since January of this year.

This is where the mainstream’s story about Europe’s beaten down banking sector starts. It’s a story of being “hit hard,” of credit losses which exceed those in the 2008 financial crisis — and finally, the onset of “more pain” in the future. All “thanks” to the coronavirus.

Except, it’s a mistake to blame Europe’s banking sector sell-off on the coronavirus.

Yes, the sector fell 43% since the start of 2020, but that’s not when the “beat down” started!

It began in 2018 — many months before the first reported case of coronavirus on December 31, 2019.

Back in 2018, the EuroStoxx 600 was a top-performer and stood at a two and a half-year high.

At the time, there was no bearish “fundamental” backdrop like the coronavirus, and few things suggested to mainstream analysts any weakness ahead.

BUT — on April 6, 2018, Elliott Wave International’s Monday-Wednesday-Friday publication European Short Term Update showed subscribers this red line down for emphasis and said,

April 6, 2018 forecast: “…banks have a long way further to fall. Stay immediately bearish this sector.”

From there September 2019, the sector plunged 40%. A rally into the end of 2019 was met with renewed optimism that “Europe’s bank stocks poised for best start to a year since 2013.” (Bloomberg)

But to Elliott Wave International’s analysts, further bearish potential was clear.

As you may know, Elliott wave analysis doesn’t look at the so-called fundamentals. Factors like unemployment, GDP, etc., don’t lead the stock market — they follow it.

In other words, to know the stock market’s next move, you must skip “fundamentals” and instead look at market psychology, the true driver of trends.

That’s exactly what Elliott wave patterns in market charts show you.

Which brings us to this year’s continued sell-off in Europe’s banking sector.

On January 13, 2020, well before coronavirus really got going, Elliott Wave International’s European Short Term Update identified a completed countertrend advance on the Banks Sector index.

January 13, 2020 forecast: Europe’s bank stocks “should decline directly.”

From there, the sector indeed hit the skids in a sell-off to levels not seen in more than a decade — that 43% slide we mentioned earlier.

And please note this: Elliott Wave International’s analysis didn’t mention coronavirus even once when making that bearish January 13 forecast. The bearish outlook was based on the fact that the price pattern called for a 3rd wave down directly ahead.

Third waves are fastest and strongest parts of the Elliott wave patterns. That helps explain the speed and ferocity of this year’s decline in Europe’s banking sector.

This is just one example (of MANY!) where Elliott Wave International’s European Financial Forecast Service put subscribers on the right side of the trend.

What are we saying now? What’s next for Europe, its markets and economies?

See for yourself right now, 100% free.

Through July 1, read Elliott Wave International’s Europe-focused publications free during the ongoing FreeWeek: Europe event.

“Free” means free. There is no catch. There is no credit card required. You can see where Europe’s key markets and economies are headed next, according to Elliott waves. Just click the link below for instant access to the latest forecasts.

Now in Progress: Join FreeWeek Europe Now

This article was syndicated by Elliott Wave International and was originally published under the headline Europe’s Banking Sector: When (and Why) the Rout Really Began. EWI is the world’s largest market forecasting firm. Its staff of full-time analysts led by Chartered Market Technician Robert Prechter provides 24-hour-a-day market analysis to institutional and private investors around the world.

Another Rate Cut By Banxico Today?

By Orbex

Mexico’s central bank has cut interest rates 8 times since it started its current loosening cycle last year. It has now cut a total of 275 basis points.

That’s the second-fastest pace and largest cut of central banks in the world. But at 5.5%, Mexico still has one of the highest (inflation-adjusted) interest rates in the world.

However, it doesn’t seem to be enough to jumpstart the economy. And there are various expectations of further rate cuts in the near future.

The Banxico is in an especially difficult place. The Mexican economy already heading into a recession even before COVID reached the country.

It’s understandable that their focus is much more on the exchange rate and economic activity, and that they don’t care so much about inflation.

Without an improvement in underlying economic activity, we can expect this to be the theme not just for this meeting, but for the next several months

What We Are Expecting

There is a near-unanimous consensus that the Banxico will cut interest rates again by another 50 basis points. This would bring the rate to 5.0%.

Expectations are for the subsequent press conference to be quite pessimistic. The Governor is likely to reiterate that further action is necessary. That’s also what the market is pricing in, so it’s unlikely that there will be a sudden move in the MXN immediately after the policy decision.

One of the things that affect the market reaction to Mexican rate decisions is that the central bank is seen as unsure between contradictory positions. It tries to signal a need to boost the economy while at the same time trying to keep markets from overheating.

The lack of clarity makes projecting future policy harder. Therefore, it gets in the way of pricing in market reaction.

Standing Out Isn’t Always the Best

The Banxico stands out among its Latin American peers as having the smallest deviation from its regular policy, despite being in the middle of a pandemic.

There has been increasing criticism that the central bank hasn’t done enough to help the economy. Political pressure might propel more aggressive action in the future, even as other countries stabilize policy.

Ironically for the central bank trying to keep a lid on the exchange rate, expectations of further cuts in the rates might make it harder to control the currency’s depreciation compared to peers.

Future Trajectory

While there is a strong consensus for today’s meeting, after that, analyst consensus diverges a bit.

All the surveyed economists predict that the Banxico will cut rates by at least another percent from today to the end of the year. A small majority, however, project an even more drastic cut, to reach between 3.0-3.5%.

With the inflation rate projected to be in that range for this year, it would effectively mean cutting rates to 0%

The consensus is that the underlying economic circumstances won’t change the trajectory of the policy all that much. Rates are expected to fall while the Banxico tries to talk up the currency. More “hawkish cuts” appear to be in store.

By Orbex

Ichimoku Cloud Analysis 25.06.2020 (EURUSD, GBPUSD, USDCAD)

Article By RoboForex.com

EURUSD, “Euro vs US Dollar”

EURUSD is trading at 1.1246; the instrument is moving below Ichimoku Cloud, thus indicating a descending tendency. The markets could indicate that the price may test the cloud’s downside border at 1.1265 and then resume moving downwards to reach 1.1135. Another signal in favor of further downtrend will be a rebound from the resistance level. However, the bearish scenario may be canceled if the price breaks the cloud’s upside border and fixes above 1.1310. In this case, the pair may continue growing towards 1.1395.

EURUSD
Risk Warning: the result of previous trading operations do not guarantee the same results in the future

GBPUSD, “Great Britain Pound vs US Dollar”

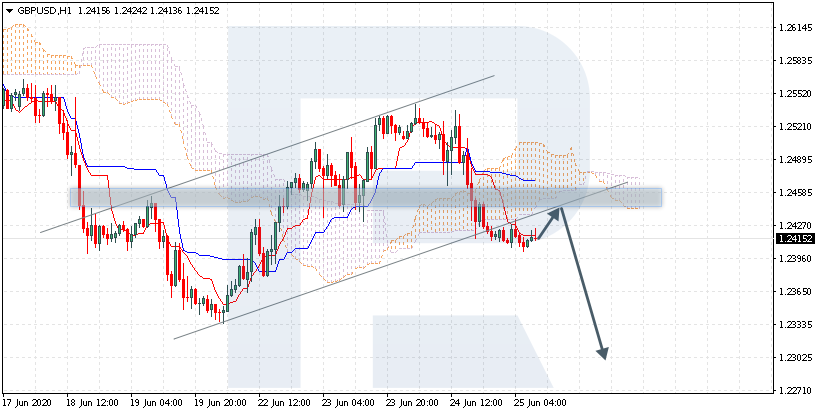
GBPUSD is trading at 1.2415; the instrument is moving below Ichimoku Cloud, thus indicating a descending tendency. The markets could indicate that the price may test the cloud’s downside border at 1.2440 and then resume moving downwards to reach 1.2305. Another signal in favor of further downtrend will be a rebound from the rising channel’s downside border. However, the bearish scenario may no longer be valid if the price breaks the cloud’s upside border and fixes above 1.2525. In this case, the pair may continue growing towards 1.2715.

GBPUSD
Risk Warning: the result of previous trading operations do not guarantee the same results in the future

USDCAD, “US Dollar vs Canadian Dollar”

USDCAD is trading at 1.3643; the instrument is moving above Ichimoku Cloud, thus indicating an ascending tendency. The markets could indicate that the price may test Tenkan-Sen and Kijun-Sen at 1.3600 and then resume moving upwards to reach 1.3725. Another signal in favor of further uptrend will be a rebound from the rising channel’s downside border. However, the bullish scenario may no longer be valid if the price breaks the cloud’s downside border and fixes below 1.3525. In this case, the pair may continue falling towards 1.3435.

USDCAD

Article By RoboForex.com

Attention!
Forecasts presented in this section only reflect the author’s private opinion and should not be considered as guidance for trading. RoboForex LP bears no responsibility for trading results based on trading recommendations described in these analytical reviews.

Japanese Candlesticks Analysis 25.06.2020 (USDCAD, AUDUSD, USDCHF)

Article By RoboForex.com

USDCAD, “US Dollar vs Canadian Dollar”

As we can see in the H4 chart, USDCAD is still rebounding from the support level and reversing after completing a Harami reversal pattern. At the moment, the pair is moving below the resistance level. However, considering the current downtrend, one may assume that the asset may finish the correction and test 1.3700. Still, an opposite scenario suggests that the instrument may fall to reach 1.3400

USDCAD
Risk Warning: the result of previous trading operations do not guarantee the same results in the future

AUDUSD, “Australian Dollar vs US Dollar”

As we can see in the H4 chart, AUDUSD is still correcting within the uptrend. By now, it has formed a Hammer pattern not far from the channel’s downside border. The target of the reversal pattern is the closest resistance level. Later, the price may resume the rising tendency. In this case, the mid-term upside target remains at 0.7070. At the same time, one shouldn’t exclude another scenario, which implies that the instrument may continue falling towards 0.6780.

AUDUSD
Risk Warning: the result of previous trading operations do not guarantee the same results in the future

USDCHF, “US Dollar vs Swiss Franc”

As we can see in the H4 chart, after forming a Hammer pattern and reversing, USDCHF has rebounded from the support level. At the moment, the pair continues forming the rising impulse. In this case, the upside target is the resistance area at 0.9520. Later, the market may rebound from this level and resume trading downwards. In this case, the downside target may be the support level at 0.9385.

USDCHF

Article By RoboForex.com

Attention!
Forecasts presented in this section only reflect the author’s private opinion and should not be considered as guidance for trading. RoboForex LP bears no responsibility for trading results based on trading recommendations described in these analytical reviews.

Currencies slip against USD as trade war fears resurface

By Orbex

Euro Back At Technical Support, But Can It Hold?

The euro currency is trading weaker on Wednesday after failing to keep up on the momentum from the previous session.

The common currency erased all gains from earlier as it moved back to the lower technical support near 1.1261.

This potentially creates a short term sideways range with the technical resistance at 1.1347 holding up as well. A breakout from either of these levels is needed.

We suspect that the risk is to the downside unless there is a rebound. A break down below the support area at 1.1261 will open the way for EURUSD to test the 1.1132 level this time around.

But, this will be subject to prices closing the previous lows near 1.1173.

GBPUSD Tumbles But Remains Range-Bound For Now

The pound sterling is down near 0.60% on the day, erasing some of the gains from the previous few sessions.

The reversal came after the pound sterling failed to breakout above the technical resistance level near 1.2516.

This has pushed price lower as a result. But the declines are limited for the moment.

GBPUSD is likely to find support near the 1.2368 level from which iT recovered earlier on.

However, if price breaks down below this level, it opens the risk for further declines.

The next key support area is around the 1.2250 level marking the 28 May lows.

WTI Slips On Inventory Build

WTI Crude oil prices are down over 3% intraday. The declines come just after prices touched a three-month high near 41.50.

Following this gain, oil prices are trading back below the 40 handle which had proven to be a bit of a struggle to break earlier on.

Currently, WTI crude oil is likely to slip further to the lower support area around the 37.67 handle.

We expect support to hold in here as it might attract new buyers into the market.

But there is a real risk of prices collapsing further pushing oil back to the lower support area at 34.42.

A test of this level could potentially cement the upside considering that the 34.42 handle wasn’t tested firmly.

Gold Prices Pause As Momentum Slows

The precious metal is seen slowing down its gains following the recent breakout.

There seems to be a technical resistance near the 1774.50 handle.

Still, at the time of writing gold prices are attempting to break out above this level. This will keep the 1800 level within sight for the precious metal.

However, there is also a risk of a pullback. We could expect to see a possible correction if gold prices close below the recent intraday lows of 1766.87.

A daily close below this level could see a move to the 1747 handle, followed by a retest of the 1732 level in order for support to be established.

By Orbex

Crude Reverses As Inventories Rise Further

By Orbex

Inventories Rise Again

The latest report from the Energy Information Administration showed that in the week ending June 19th, US crude stores rose by a further 1.4 million barrels.

This was above the rise in inventories recorded last week. It also surpassed the expected 1.2 million barrel reading the market was looking for. Once again, this reflects a lack of demand for fuel products, despite lockdown measures easing in the US.

The total products supplied number is used as a proxy to gauge overall demand. This number was down over the last four weeks by an average of 8 million barrels per day. This is 17% lower than the same period last year.

Second Wave Creating Headwinds

Crude oil prices have been back under this pressure this week. This comes as a result of a trickier risk environment, as equities retreat on rising fears of a second wave of COVID-19.

Fears of a fresh outbreak have taken the shine off the recovery underway across the globe as lockdown measures ease. Unfortunately, many countries are reporting fresh increases in the number of new infections.

Parts of the US has been reporting their highest numbers of the pandemic so far. This led to Apple announcing that it will temporarily close 11 US sites in response.

Elsewhere, China has placed Beijing back under lockdown. The city has reintroduced travel restrictions as, it too, deals with a fresh surge in infection numbers.

Meanwhile, in the UK, as the government prepares to ease lockdown measures further on July 4th, health authorities have warned of the risks of an increase in the virus.

Traders have been shying away from riskier assets this week including oil prices which have seen heavier selling following decent buying on Monday.

The risks of a return to lockdown measures in the event of a second wave raise obvious risks for crude oil. The commodity saw demand decimated over the first half of the year as a result of the virus.

Bullish Forecasts From Citigroup

The outlook is not totally bleak, however. Analysts at Citigroup see crude prices recovering to north of $60 over the next 18 months.

This would be fuelled by the heavy supply cuts in effect from OPEC+, along with the reduction in shale oil output as producers reduce activity amidst the price crash.

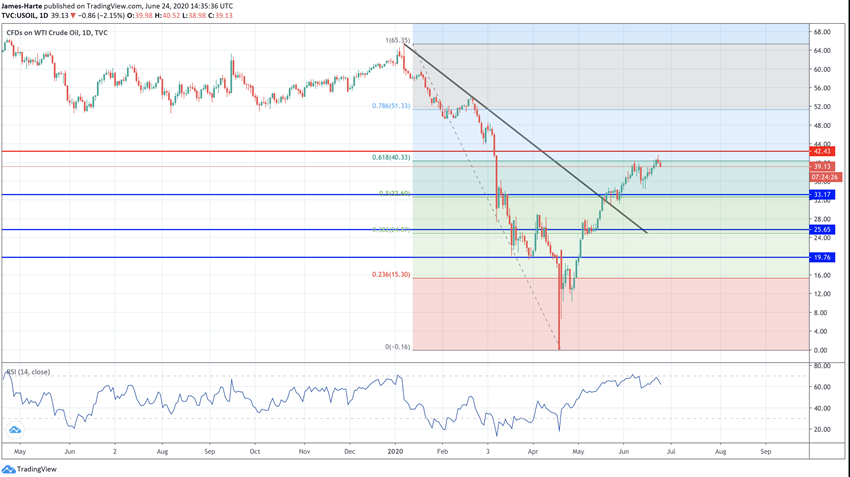
Crude Still Capped by 61.8%

Crude oil price made a fresh attempt at breaking above the 61.8% retracement of the decline from 2020 highs this week. However, the level continues to hold as resistance.

With bearish divergence showing on the RSI, the risk of a correction back lower is increasing. While price remains supported at the 33.17 level, however, focus remains on a further push higher and an eventual break of the 42.43 level.

By Orbex

COVID-19 is laying waste to many US recycling programs

By Brian J. Love, University of Michigan and Julie Rieland, University of Michigan

The COVID-19 pandemic has disrupted the U.S. recycling industry. Waste sources, quantities and destinations are all in flux, and shutdowns have devastated an industry that was already struggling.

Many items designated as reusable, communal or secondhand have been temporarily barred to minimize person-to-person exposure. This is producing higher volumes of waste.

Grocers, whether by state decree or on their own, have brought back single-use plastic bags. Even IKEA has suspended use of its signature yellow reusable in-store bags. Plastic industry lobbyists have also pushed to eliminate plastic bag bans altogether, claiming that reusable bags pose a public health risk.

As researchers interested in industrial ecology and new schemes for polymer recycling, we are concerned about challenges facing the recycling sector and growing distrust of communal and secondhand goods. The trends we see in the making and consuming of single-use goods, particularly plastic, could have lasting negative effects on the circular economy.

Goodwill’s Canton, Mich. site looks overwhelmed on June 16, 2020, with an oversupply of donations and little immediate chance for resale.
Brian Love, CC BY-ND

Recyclers under pressure

Since March 2020, when most shelter-in-place orders began, sanitation workers have noted massive increases in municipal garbage and recyclables. For example, in cities like Chicago, workers have seen up to 50% more waste.

According to the Solid Waste Association of North America, U.S. cities saw a 20% average increase in municipal solid waste and recycling collection from March into April 2020. Increased trash can be attributed partly to spring cleaning, but most of it is due to people spending greater time at home. Restaurants struggling to survive under COVID-19 restrictions are contributing to the rise in plastic and paper waste with takeout packaging.

Although higher volumes of recyclables are being set on the curb, budget deficits are squeezing recycling programs. Many municipalities are struggling with multimillion-dollar shortfalls. Some communities, such as Rock Springs, Wyoming, and East Peoria, Illinois, have cut recycling programs.

And these stresses are testing a business already faced uncertainty.

While bottle deposit stations remain closed, recyclables pile up in basements and garages.
David Rieland, CC BY-ND

Turmoil in scrap markets

The global recycling economy has suffered since 2018 as first China and then other Asian nations banned imports of low-quality scrap – often meaning improperly cleaned food packaging and poorly sorted recyclable materials. As in any business, the value of raw recyclables is linked to supply and demand. Without demand from nations like China, which formerly took up to 700,000 tons of U.S. scrap annually, recyclers have scrambled to stay in business.

The pandemic has boosted prices for some materials. One industry leader told us that between February and May 2020, prices doubled for recycled paper and tripled for recycled cardboard. These shifts reflect higher demand for tissue products and shipping packaging under shelter-in-place orders.

However, he also reported that prices for the most-recycled categories of reclaimed plastics – PET (#1) and PE (#2 and #4) – were at 10-year lows. An influx of cheap oil has driven the raw material cost of oil-derived virgin plastics to their lowest levels in decades, outcompeting recycled feedstocks.

Difficult economics

Ideally, revenues from recycling offset municipalities’ costs for collecting and disposing of solid wastes. However, given worker safety concerns, low market prices for scrap materials, a slowed economy and cheaper alternatives for disposal, many communities and businesses across the U.S. have temporarily suspended collection of recyclables and bottle deposits.

Meanwhile, as the commercial sector slowed, the distribution of waste generation changed. As people have spent more time producing waste at home, waste collectors implemented new procedures to protect their employees from infection.

Recycling is a very hands-on process that requires workers to manually sort out items from the collection stream that are unsuitable for mechanical processing. Workers and waste collection companies have raised many safety questions about recycling during the pandemic.

Precautions like social distancing and use of personal protective equipment have become commonplace among waste collectors and sorters, though concerns remain. Sorters are increasingly relying on automation, but implementation can be costly and takes time.

Collections on pause

Based on monitoring since 2017 by the trade publication Waste Dive, nearly 90 curbside recycling programs had experienced or continue to experience a prolonged suspension over the past several years. About 30 of these suspensions have occurred since January 2020.

Like many bottle deposit programs, Kroger’s Ann Arbor, Mich. drop-off center shut down on March 23. Michigan bottle deposits across the state resumed on June 15, 2020 with new safety protocols.
Brian Love, CC BY-ND

On a broader scale, it’s not clear how much more waste Americans are currently producing during shutdowns. Commercial and residential waste aren’t directly comparable. For example, a granola bar wrapper thrown away at the office is tallied differently than if discarded at home.

It is also challenging to quantify the effects of the pandemic while it is still unfolding. Historically, waste output from the commercial and industrial sectors has far outweighed the municipal stream. With many offices and business closed or operating at low levels, total U.S. waste production could actually be at a record low during this time. However, data on commercial and industrial wastes are not readily available.

At the California-based Peninsula Sanitary Service, which serves the Stanford University community, total tonnage was down 60% in March. The company attributes this drop to reduced commercial waste, particularly from construction. Similarly, the city of Vancouver, British Columbia, noted a 10% decrease year over year of waste collection levels for April.

Expected sectors of plastic waste increase due to COVID-19, based on 2018 plastic usage distribution data from PlasticsEurope and Klemes et al., 2020.
Brian Love and Julie Rieland, CC BY-ND

More plastic trash

As cities and industries reopen in the coming months, new data will show the pandemic’s effects on consumer habits and waste generation. But regardless of total volume, the mix of materials in household wastes has shifted given the new ubiquity of single-use plastic containers, online shopping packaging and disposable gloves, wipes and face masks. Many of these new staples of pandemic life are made from plastics that are simply not worth recycling if there are any other disposal options.

Today Americans are trying to balance their physical well-being against ever-mounting piles of plastic waste. At a time when reducing and reusing could be dangerous, and recycling economics are unfavorable, we see a need for better options, such as more compostable packaging that is both safer and more sustainable.

About the Author:

Brian J. Love, Professor of Materials Science and Engineering, University of Michigan and Julie Rieland, PhD Candidate in Macromolecular Science and Engineering, University of Michigan

This article is republished from The Conversation under a Creative Commons license. Read the original article.


Gold, Silver, Platinum, Palladium, Miners, Oil, Bitcoin

By TheTechnicalTraders


Get our Active ETF Swing Trade Signals or if you have any type of retirement account and are looking for signals when to own equities, bonds, or cash, be sure to become a member of my Passive Long-Term ETF Investing Signals which we are about to issue a new signal for subscribers.

Chris Vermeulen
Chief Market Strategies
Founder of Technical Traders Ltd.

TheTechnicalTraders.com


Gold & Silver Begin The Move To New All-Time Highs

By TheTechnicalTraders 

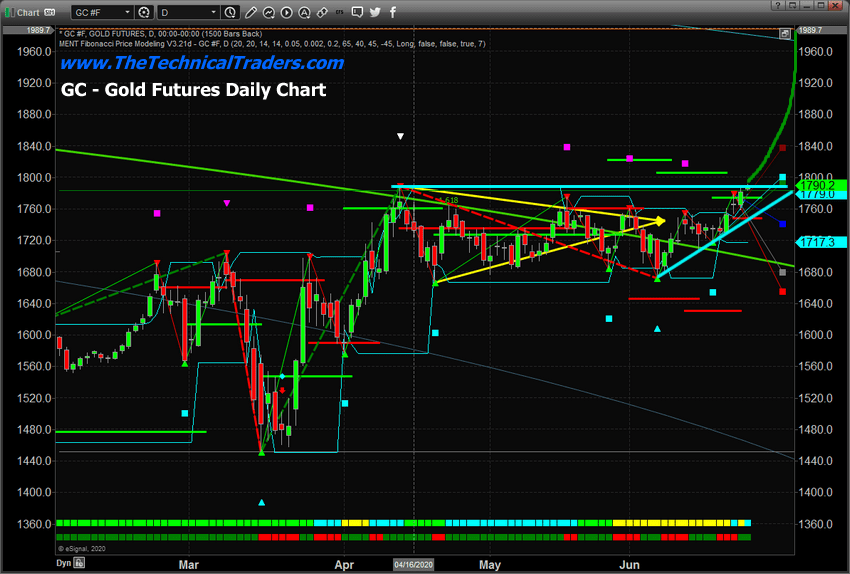
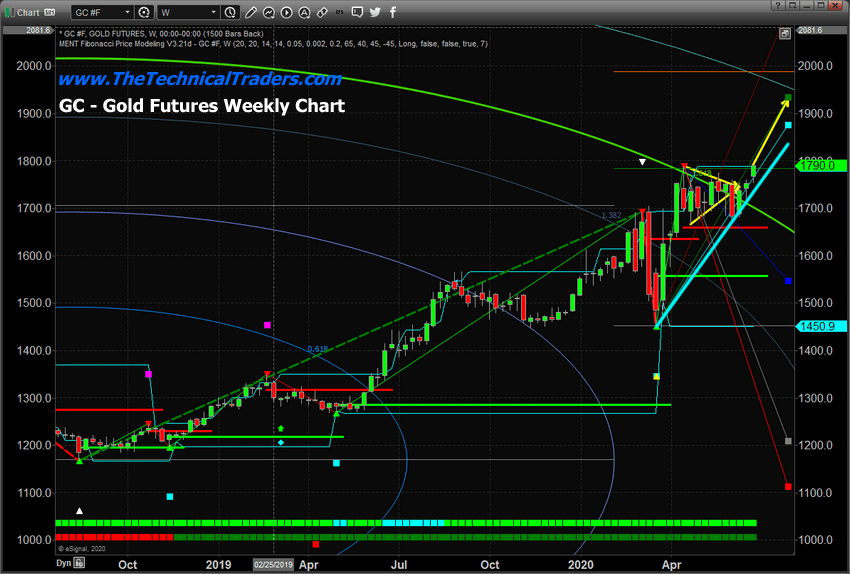
– We warned about this move many months ago and just 6 days ago we issued a research post suggesting Gold had cleared major resistance and would start a rally mode to push above $2000 – possibly above $2100.  Well, guess what happened right after we made that statement? Yup – Gold started to rally higher and is currently trading near $1790 – about to break $1800 for the first time in 2020.

You can read some of our most recent Gold articles below:

June 3, 2020: Gold & Silver “Washout” – Get Ready For A Big Move Higher

June 18, 2020: Gold Has Finally Cleared Major Resistance – Time For Liftoff

June 20, 2020: All That Glitters When The World Jitters Is Probably Gold

HOW WILL GOLD REACT IN THIS PARABOLIC RALLY?

What we really want you to focus on is the fact that Gold is rallying to levels above $1800 (near all-time highs) while the US stock market has entered an upside parabolic price trend.  What does it mean when metals are rallying and the stock market is rallying at the same time?  The supply-side of precious metals has been restricted because of the COVID-19 virus event and central banks have been accumulating Gold and Silver over the past 7+ years by large amounts.  This suggests central banks and precious metals traders believe metals prices will continue to skyrocket while the risks to the equities markets, credit markets, and global economy increases.

Gold prices climbed in the early 2000s after the DOT COM bubble burst (starting to rise in 2002).  The US stock market eventually bottomed near April 2003 – yet Gold continued to rally from near the $281 level to $992 in early 2008 – a massive +665% over just 5 years.

Gold continued to rally after some wild rotation near the 2008 peak in the US stock market.  Gold bottomed in November 2008 near $710 before rallying to $1924 in September 2011.  This rally took place while the US stock market was also rallying because of the fear in the market from the 2008 (and 1999 DOT COM), market collapse events had not subsided.  Traders and Investors were still very fearful of the truth of the economic recovery and stock market recovery at that time – so they continued to hedge in precious metals.

Before you continue, be sure to opt-in to our free market trend signals 
before closing this page, so you don’t miss our next special report!

Right now, the US stock market has entered a massive parabolic upside price move while Gold is starting a breakout upside price move targeting the 2011 all-time high near $1924.  What this is telling us is that global investors and traders are very fearful of this rally in the stock market and are actively hedging in Gold and Silver.  Traders understand the risks to the credit and banking system and are playing the rally in the stock market cautiously while “loading up” on Gold as a means to protect against unknown risks.

Read the first part of our “Markets Go Parabolic” article below:

June 23, 2020: US Stock Market Enters Parabolic Price Move – Be Prepared, Part I

HOW BIG COULD THE RALLY IN GOLD REALLY BE?

We believe the upside price move in Gold, coinciding with a potential parabolic upside price move in the US stock market, could represent a very unique scenario where the US Federal Reserve and Global Central Banks have entered the ultimate battle to attempt to regain control of the global capital and credit markets after the 2008 credit crisis and the current COVID-19 economic crisis.  The only reason Gold is climbing to near new all-time high levels is that global risk has become a major issue and the US Fed as well as central banks are doing everything possible to provide capital liquidity and support through what may become an extended global recession.

Right now, Gold is hedging global market risks and unknowns.  Once Gold clears the $2000 price level, we believe Gold will enter a parabolic upside price trend that could accelerate well above $3250 very quickly – possibly before the end of 2020.  This would indicate that global traders and investors have priced global market risk at likely 3x higher than most common risk-off market scenarios.  The only other time when this extreme risk factoring took place in Gold was in early 1980 when interest rates were 15% or higher and the US economy had entered a period of stagflation (the late 1970s).  At that time, the price of Gold reached nearly 7x the price of the SPX at that time before contracting after a peak in 1981.

If our research is correct, Gold has just begun an upside price rally that will attempt to hedge credit and global market risks resulting from the past 10+ years of US Federal Reserve and global central bank intervention.  The attempts of the global central banks to support the credit and capital markets have created a massive credit/debt bubble that has pushed the US stock market into an incredible bubble rally.  We’ve seen nothing like this in recent history.

Until fiscal responsibility returns to the global markets, expect Gold and Silver to continue to hedge global risks and while the world continues to expand debt and credit in an attempt to support weaker economic data/output – continue to expect hedging to continue.  Until global investors perceive the debt/credit risks have abated – Gold and Silver will continue to rally in an attempt to hedge the massive risks to the global credit and banking sectors.

At this point – it is like a game of “chicken”.  Either the global central banks find some way to prompt organic economic growth or the precious metals markets will continue to illustrate the fear in the markets related to credit risks.  Should the credit markets or banking sector collapse or experience any real extended risks, Gold could rally to unbelievable levels (like in 1979~80; where the price of Gold was over $650 per ounce and the price of the SPX was $110).  If that were to happen at today’s levels, Gold would reach levels above $22,250 or higher.  Think about it.

We continue to urge our clients to stay very cautious of the current price rally in the US stock market as we continue to see risks shuffling just below the surface.  Watch Gold and Silver.  Once these metals start to really breakout, you are going to see a big shift in how investors perceive risk in the global markets.  Read our article about the US stock market going parabolic – it is important that you understand what is happening right now.

WHAT WOULD THAT LOOK LIKE FOR SILVER?

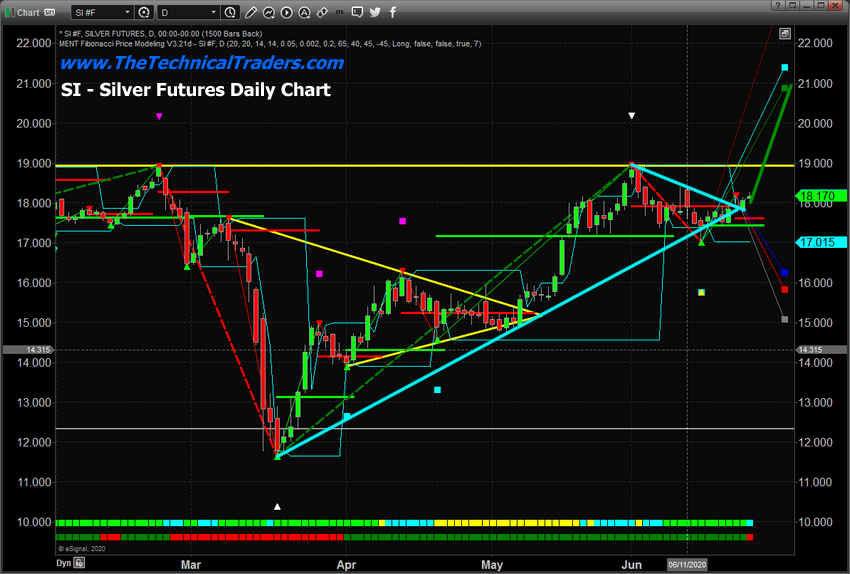
Silver is likely one of the most incredible opportunities for skilled technical traders ever.  This secondary precious metal is still trading below $19 per ounce – well below the $50 per ounce peak reached in 2011.  If you understand our logic and can appreciate how Gold could rally to levels above $5000 or $10,000 because of extreme risk factoring, then consider that Silver could rally to levels above $250 per ounce given the same risk factors – that’s a 1300% price increase.

This is why we continue to urge our clients and followers to stay cautious – stay very cautious.  We’ve been mostly in cash and have been executing very selective “low allocation” trades over the past 5+ months.  We called for a massive super-cycle event in August 2019 based on our 600+ year super-cycle modeling.  When that longer-term super-cycle was delayed because of the US/China trade deal news near the end of 2019, we knew the super-cycle event would happen at some point in the near future.  Along comes the COVID-19 event about 60 days later.  It just took another 2 months for the world to understand how much risk was involved in a global pandemic event.  The process of the world reacting to the COVID-19 risks set off a series of events that leads us to right now.

Pay attention.  There will be no Mulligans in this round of play.  You’ll either be prepared for what is likely to happen or you’ll take far greater risks than you should throughout the next 5+ years.  We’re here to help.  Read our research and learn how we can help you protect and grow your wealth.

Get our Active ETF Swing Trade Signals or if you have any type of retirement account and are looking for signals when to own equities, bonds, or cash, be sure to become a member of my Passive Long-Term ETF Investing Signals which we are about to issue a new signal for subscribers.

Chris Vermeulen
Chief Market Strategies
Founder of Technical Traders Ltd.

TheTechnicalTraders.com


Uber, WeWork, Airbnb – how coronavirus is bursting the tech bubble

By John Colley, Warwick Business School, University of Warwick

A handful of technology companies have benefited from coronavirus. Amazon has profited handsomely, as have streaming and video conferencing platforms like Netflix and Zoom. But the pandemic has laid bare the shaky foundations of a number of other platforms that bill themselves as technology companies and have enjoyed the high valuations that come with this label.

Major losers from the pandemic include the ride hailing apps: Uber, Grab (in South East Asia), Ola (India) and Didi Chuxing (China). Quite simply, people are not taking taxis. Office sharing businesses such as WeWork (which was, of course, already struggling) are also in trouble with virtually no occupancy. A similar situation is occurring in the accommodation sector with Airbnb and hotel bookings start-up Oyo.

As a result, investment in tech businesses is crumbling. But at the same time this is clearing the way for the few winners to buy bigger stakes in those that are struggling.

Swimming naked

Two decades on from the dot-com collapse there is the likelihood of another crash in the technology sector. As with the build up to the dot-com bubble, an abundance of venture capital funding has fuelled speculation and encouraged investors to make bets on the next Google or Amazon.

As Warren Buffett once said: “Only when the tide goes out will we see who has been swimming naked.” In effect, the tide has gone out and lots of start-ups that were billed as revolutionary technology companies are all in significant trouble.

The only redeeming feature at the moment is how much cash many start-ups have to withstand the collapse. How long they have will vary. WeWork will struggle to survive a year without further investment. The ride hailing apps meanwhile are well funded but may also find this to be a very difficult year. They are under pressure to cut their losses and break even but this goal is even further away now.

Image by PublicDomainPictures from Pixabay

The secretive Airbnb has recently been raising money at high cost. This suggests investors see a significant risk to the business and so cash is limited. The proposed listing this year is now highly unlikely.

A major problem with lots of the start-ups that are now struggling is that they look like technology businesses but they have merely used new technology to disrupt existing industries. Uber follows the dynamics of the taxi industry, WeWork the office rental industry, and Airbnb the accommodation booking industry.

Winner takes all

Facebook, Amazon and Google differ in that they all started new industries. They created network effects – where the more people that use the platform, the better it becomes – from which they benefited enormously.

Network effects can create a winner takes all situation. The more of your friends and colleagues who are on a particular social network the more likely you are to join and use it. Similarly the more suppliers who compete to sell on Amazon, the more choice and competitive prices is offered to customers. Having more customers attracts more sellers.

It is harder to see the network effects in businesses like WeWork – there are few reasons to be loyal and the entry barriers to market for competitors are low. Even with taxi ride hailing apps, in which Uber was a first mover, all taxi firms now have an app and network effects are quite limited once a level of responsiveness has been achieved – it’s easy for customers and drivers to switch to competition apps.

Similarly, accommodation booking sites are all accessed in the same way now via an app, and it is very easy to compare accommodation availability and costs. Airbnb was a first mover in home rental but this sector has been beset by issues relating to fraud and safety.

Hence all these markets are going to remain very competitive in the longer term and this means low margins and low returns. It is no surprise the share prices of ride hailing businesses have halved. In these industries technology is no longer a competitive advantage as almost all the competitors now have similar technology. The technology is simply infrastructure.

Cash flow and consolidation

Stock markets are shaky and Airbnb has cancelled its initial public offering. The appetite for new listings is weak and is likely to remain this way, suggesting it will be difficult for venture capital investors to exit their investments. If there is no exit route to make money, then why invest?

A consequence is that there is likely to be a reduction in investment in technology start-up businesses. Cash will be in much shorter supply and venture capital investors will have to choose more carefully where to invest.

Meanwhile, we are already seeing the real technology giants move in. Amazon, for example, was the biggest investor in distressed UK takeaway app Deliveroo’s latest round of fundraising. This month also saw the merger of two other food delivery services, with Europe-based Takeaway.com, fresh from buying Just Eat, now buying US-based Grubhub. We can expect more consolidation in the months ahead.The Conversation

About the Author:

John Colley, Professor of Practice, Associate Dean, Warwick Business School, University of Warwick

This article is republished from The Conversation under a Creative Commons license. Read the original article.