Author Archive for InvestMacro – Page 19

After 2nd Quarter Carnage, the Quest for Philippine Recovery

By Dan Steinbock

– Recently, the IMF downgraded most growth projections, due to weaker private consumption and elevated uncertainty in investment. Those are the twin engines of the Philippine economy. So, what’s ahead for economic recovery?

As I wrote in a report 2 months ago (click here), the global economic outlook of the International Monetary Fund (April 2020) was too optimistic. Last week, the IMF downgraded most of its projections. Now global growth is projected at -4.9% in 2020, almost 2 percentage points below the previous forecast.

Consumption growth has been downgraded for most economies, due to the larger-than-anticipated disruption to domestic activity. Worse, investment is expected to remain subdued as firms defer capital expenditures amid elevated uncertainty.

If consumption growth has historically been central in the Philippines, while investment has fueled the country’s “Build, Build, Build” infrastructure drive, what’s ahead for economic recovery?

Pandemic liabilities of consumption-led growth

In the Philippines, the impact of the great coronavirus contraction began already in the 1st quarter, when the economy shrank by 0.2% on year-on-year basis.

The effect was dramatic, even though the official number of cases was still relatively low (less than 2,100 versus more than 35,000 today) and nationwide quarantine began to dampen demand only toward the end of the quarter. With plunging international conditions, travel and tourism, retail and transportation took heavy hits.

For years, the conventional wisdom was that economic growth in the Philippines is fueled by consumption. In the West, observers saw the status quo as positive because it supported foreign exports into the country.

Nevertheless, for years, I have been warning that under adverse conditions consumption-reliant economy can prove a severe liability because, without a vibrant domestic manufacturing base, such growth keeps the country under dependency.

When international conditions are positive and global economy thrives, so will Philippine consumption and economy. Unfortunately, the reverse applies as well – and that’s what we have seen in the course of the past few months.

In the 1st quarter, growth in household consumption, which accounts three-fourths of the GDP, fell flat. As the global economy has been frozen, Philippine business, investment and consumer confidence have been impaired as well.

But there’s much worse to come.

1st quarter plunge only prelude to 2nd quarter carnage

As the global coronavirus contraction spread in the first half of the year, the plunge is reflected by the revised Philippine economic outlook.

The fall of both exports and imports was only to be expected following the rapid deterioration in external demand and the disruption of supply chains.

Obviously, months of lockdowns and quarantines around the world have reverberated adversely on the supply side as well. Economic growth has decelerated in all sectors. Growth in services fell four-fifths to 1.4% on a quarterly basis, mainly as net effect of the plunge in transport and accommodation, food services, and trade.

In the past, construction, perhaps even manufacturing, was thriving. Now both fell, as did agriculture.

The current forecast for 2020 has been downgraded to -3.8%. Both household consumption and investment have slowed more than expected. And the contraction in the global economy will continue to drag external trade, tourism and remittances.

Nevertheless, the Asian Development Bank’s (current) forecast for 2021 is maintained at 6.5%, supported by public infrastructure spending and anticipated recovery in consumer and business confidence.

Thanks to its secular economic potential, the Philippines certainly could experience a strong V-shaped recovery. But it will not prove as smooth as currently anticipated. In the global economy, the plunge of the 1st quarter is just a prelude to the massive collateral damage in the 2nd quarter, which is almost over.

In the Philippines, too, new downgrades are likely to reflect the new normal in the coming months.

Hollow “lives vs livelihoods” debates

In the past few months, critics of the Duterte government first downplayed the impending economic damage associated with the coronavirus contraction. When the stance proved flawed, the tactic was reversed. More recently, they have pushed for even longer lockdowns and quarantines, despite prohibitive economic costs.

These debates are not predicated on the recovery of the Philippine economy and the well-being of its citizens. Rather, such debates, which blame the government for the global pandemic, reflect early positioning for the 2022 election – that is, political exploitation of dire economic realities.

In 2019, the budget debacle proved extraordinarily costly because it weakened Philippine output potential right before the global pandemic and the coronavirus contraction. Should they result in real political polarizations, current “lives versus livelihoods” divisions could contribute to a slower than expected recovery.

Today, all economies in Southeast Asia hope to gradually ease lockdowns, quarantines and restrictive measures. Yet, in the Philippines, some argue that the quarantines should continue longer to ensure adequate bending of the epidemic curve. They believe that lives precede livelihoods.

In contrast, others claim that such measures would be foolish because they downplay the adverse economic consequences of the quarantines. They claim that without livelihoods lives will be lost.

In reality, both sides have a point, but neither is right. Without lives, there are no livelihoods. Conversely, without livelihoods, lives will be lost. The challenge is not to choose between one or the other. The challenge is the right and timely balance between the two.

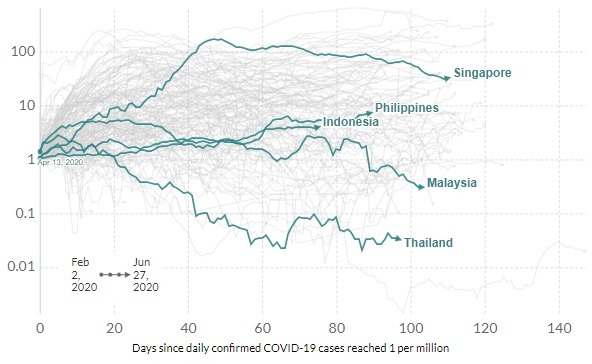
While the recent surges in confirmed cases reflect intensified testing rather than changes in the pandemic status quo, Philippine recovery cannot fully move ahead until the epidemic curve is effectively bending. And the reality is that while the Philippines is getting closer to bending the curve, it hasn’t succeeded yet in per capita terms (Figure).

Figure Getting closer to bending the curve*

Daily Covid-19 cases per million: ASEAN economies

Source: European CDC, June 27, 2020

Fiscal and monetary flexibility facing stress tests

Obviously, household consumption and investment growth has plunged in the 2nd quarter. But if the pandemic can be kept in check in the coming months and the epidemic curve finally bends, infrastructure investment and household consumption could intensify the hoped-for recovery.

The Duterte government’s infrastructure and fiscal economic changes have lifted the share of investment growth up to 27% of GDP from barely 20% in the Aquino era (2010-16). However, since the government must now allocate more to the struggle against the pandemic, public expenditure and construction outlays will be delayed.

Consequently, now it’s the time to push even harder the infrastructure drive and fiscal economic changes. If this effort proves successful, the growth forecast for the current year is still likely to hover at around -3.5% to -4.5% on a year-to-year basis. But the coming recovery could prove stronger than expected.

In the past months, the Bangko Sentral (BSP) has cut the policy rate by 125 basis points, pushing the benchmark rate down to a record low 2.75% (which is likely to cut closer to 2.0% in the coming months). The reserve requirement ratio (RRR) has been cut down to 12% (with another 200 basis-points reduction likely ahead).

Obviously, the BSP has tried to neutralize the pandemic impact on economic growth.

Recently, lower energy prices and reduced imports have offset the fall in remittances. But since global recovery is likely to prove more challenging than expected, weaker government revenues (and rising deficit) and impending stimulus package (3.1% of GDP) will stress-test fiscal policies in the second half of the year.

Challenging scenarios

If, in addition to the catastrophic consequences of the Trump administration’s failed pandemic policies, the White House will accelerate its trade wars against China and US allies in Europe and East Asia, global economic headwinds will prove much worse than expected.

In that scenario, the anticipated global recovery would prove subdued in the second half of the year and a multi-year global recession could no longer be excluded, especially as the heavily-indebted advanced economies’ recent and huge debt-taking may result in new debt crises, which could spill over to poorer countries.

Furthermore, such negative scenarios would be reinforced if the development of vaccine and viral therapies will take longer than expected.

In the coming months, the Philippines, like so many other countries, will face the greatest risks (and opportunities) since World War II. Now the margin for error in economic policies and pandemic containment is slim to nil.

About the Author:

Dr. Dan Steinbock is an internationally recognized strategist of the multipolar world and the founder of Difference Group. He has served at the India, China and America Institute (USA), Shanghai Institutes for International Studies (China) and the EU Center (Singapore). For more, see https://www.differencegroup.net

Based on Dr Steinbock’s briefing on June 27, 2020.
 

Fibonacci Retracements Analysis 29.06.2020 (GOLD, USDCHF)

Article By RoboForex.com

XAUUSD, “Gold vs US Dollar”

As we can see in the H4 chart, after breaking the high at 1764.86, XAUUSD is trying to fix above it. In the future, the price is expected to continue growing towards the post-correctional extension area between 138.2% and 161.8% fibo at 1800.60 and 1822.70 respectively. The support is at 1670.60.

GOLD_H4
Risk Warning: the result of previous trading operations do not guarantee the same results in the future

As we can see in the H1 chart, there was a divergence on MACD after the pair reached and broke the high at 1764.86, which made the price start a new correction to the downside. The first correctional impulse has already reached 23.6% fibo and may continue towards 38.2% and 50.0% fibo at 1737.75 and 1724.85 respectively. To complete the correction, XAUUSD must break the high at 1779.25.

GOLD_H1
Risk Warning: the result of previous trading operations do not guarantee the same results in the future

USDCHF, “US Dollar vs Swiss Franc”

As we can see in the H4 chart, after breaking the local correctional Triangle pattern to the downside, USDCHF is expected to break the low at 0.9376 and continue trading downwards. At the same time, the previous rising impulse may hint at further growth towards 38.2%, 50.0%, and 61.8% fibo at 0.9577, 0.9639, and 0.9700 respectively.

USDCHF_H4
Risk Warning: the result of previous trading operations do not guarantee the same results in the future

The H1 chart shows a more detailed structure of the current correction after the ascending impulse. The descending wave tested 76.0% fibo at 0.9419. The rising impulse that followed almost returned the price to 23.6% fibo and may later continue to reach the local high at 0.9553.

USDCHF_H1

Article By RoboForex.com

Attention!
Forecasts presented in this section only reflect the author’s private opinion and should not be considered as guidance for trading. RoboForex LP bears no responsibility for trading results based on trading recommendations described in these analytical reviews.

Forex Technical Analysis & Forecast 29.06.2020

Article By RoboForex.com

EURUSD, “Euro vs US Dollar”

After completing the descending structure at 1.1200, EURUSD is expected to continue the correction and grow to reach 1.1250, at least. Later, the market may form a new descending structure with the target at 1.1150.

EURUSD
Risk Warning: the result of previous trading operations do not guarantee the same results in the future

GBPUSD, “Great Britain Pound vs US Dollar”

After reaching its downside target at 1.2315, GBPUSD is correction to reach 1.2387, at least, or even 1.2425. After that, the instrument may resume falling with the target at 1.2275.

GBPUSD
Risk Warning: the result of previous trading operations do not guarantee the same results in the future

USDRUB, “US Dollar vs Russian Ruble”

USDRUB is moving upwards to break 69.70 and may continue the correction towards 70.34. After that, the instrument may start a new decline to return to 69.70 and then form one more ascending structure with the short-term target at 70.84.

USDRUB
Risk Warning: the result of previous trading operations do not guarantee the same results in the future

USDJPY, “US Dollar vs Japanese Yen”

USDJPY is consolidating below 107.36. Possibly, today the pair may fall towards 106.76 and then form one more ascending structure to break 107.36. Later, the market may continue trading upwards with the short-term target at 107.85.

USDJPY
Risk Warning: the result of previous trading operations do not guarantee the same results in the future

USDCHF, “US Dollar vs Swiss Franc”

USDCHF is consolidating around 0.9474. Today, the pair may fall towards 0.9452 and then grow to return to 0.9474. Later, the market may start a new descending correction with the target at 0.9444.

USDCHF
Risk Warning: the result of previous trading operations do not guarantee the same results in the future

AUDUSD, “Australian Dollar vs US Dollar”

After reaching the short-term downside target at 0.6840, AUDUSD is expected to correct towards 0.6900. After that, the instrument may start a new decline to break 0.6830 and then continue trading downwards with the target at 0.6785.

AUDUSD
Risk Warning: the result of previous trading operations do not guarantee the same results in the future

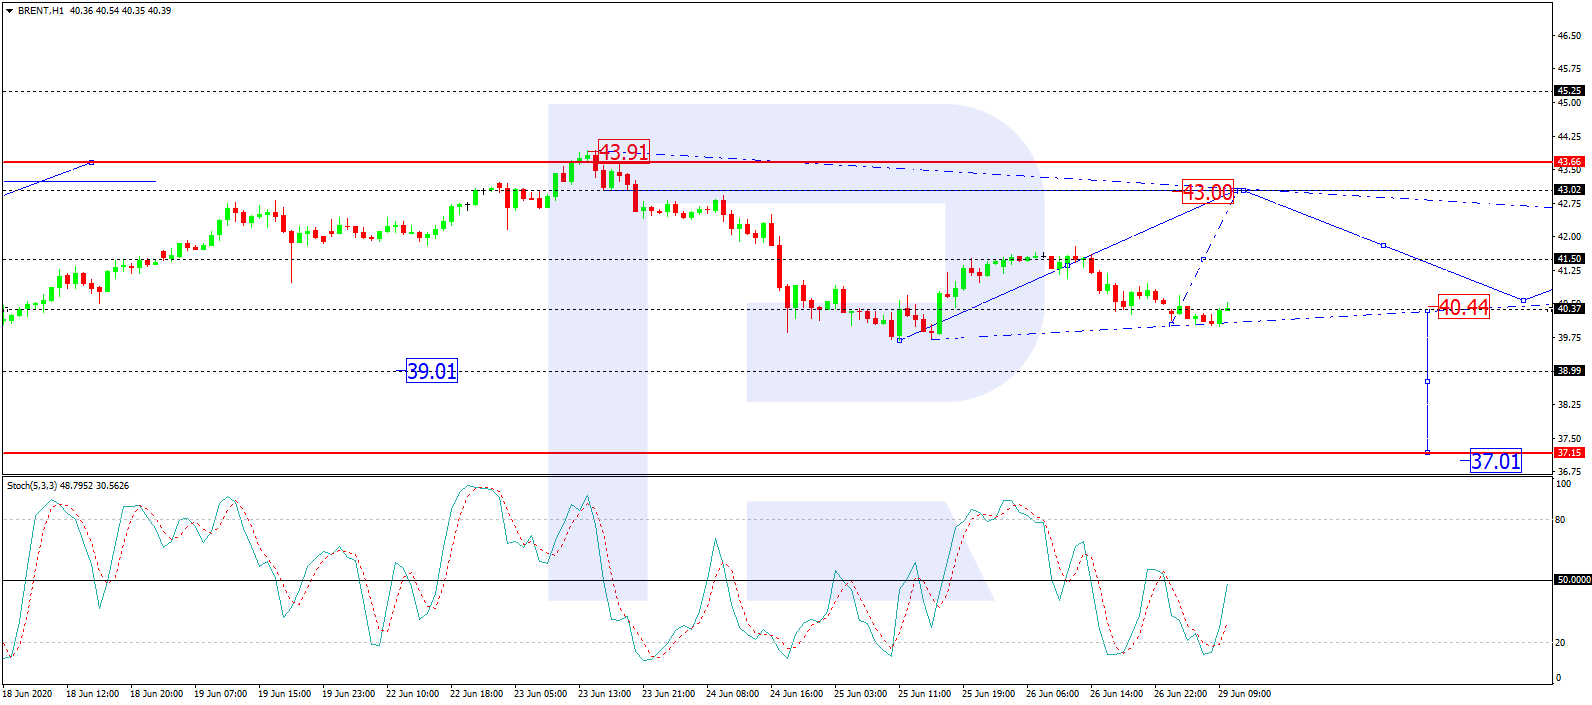
BRENT

Brent is falling to reach 39.64. After that, the instrument may start consolidating. If later the price breaks this range to the downside, the market may resume trading downwards with the short-term predicted target at 37.60.

BRENT
Risk Warning: the result of previous trading operations do not guarantee the same results in the future

XAUUSD, “Gold vs US Dollar”

Gold is forming a narrow consolidation range around 1769.85. Possibly, the pair may continue growing towards 1780.50 and then start a new correction to reach 1769.50. Later, the market may form one more ascending structure with the short-term target at 1791.85.

GOLD
Risk Warning: the result of previous trading operations do not guarantee the same results in the future

BTCUSD, “Bitcoin vs US Dollar”

After completing the descending wave at 8800.00, BTCUSD is expected to correct towards 9200.00 and test it from below. Later, the market may resume trading downwards to reach 8700.00 and then form a new consolidation range around it.

BITCOIN
Risk Warning: the result of previous trading operations do not guarantee the same results in the future

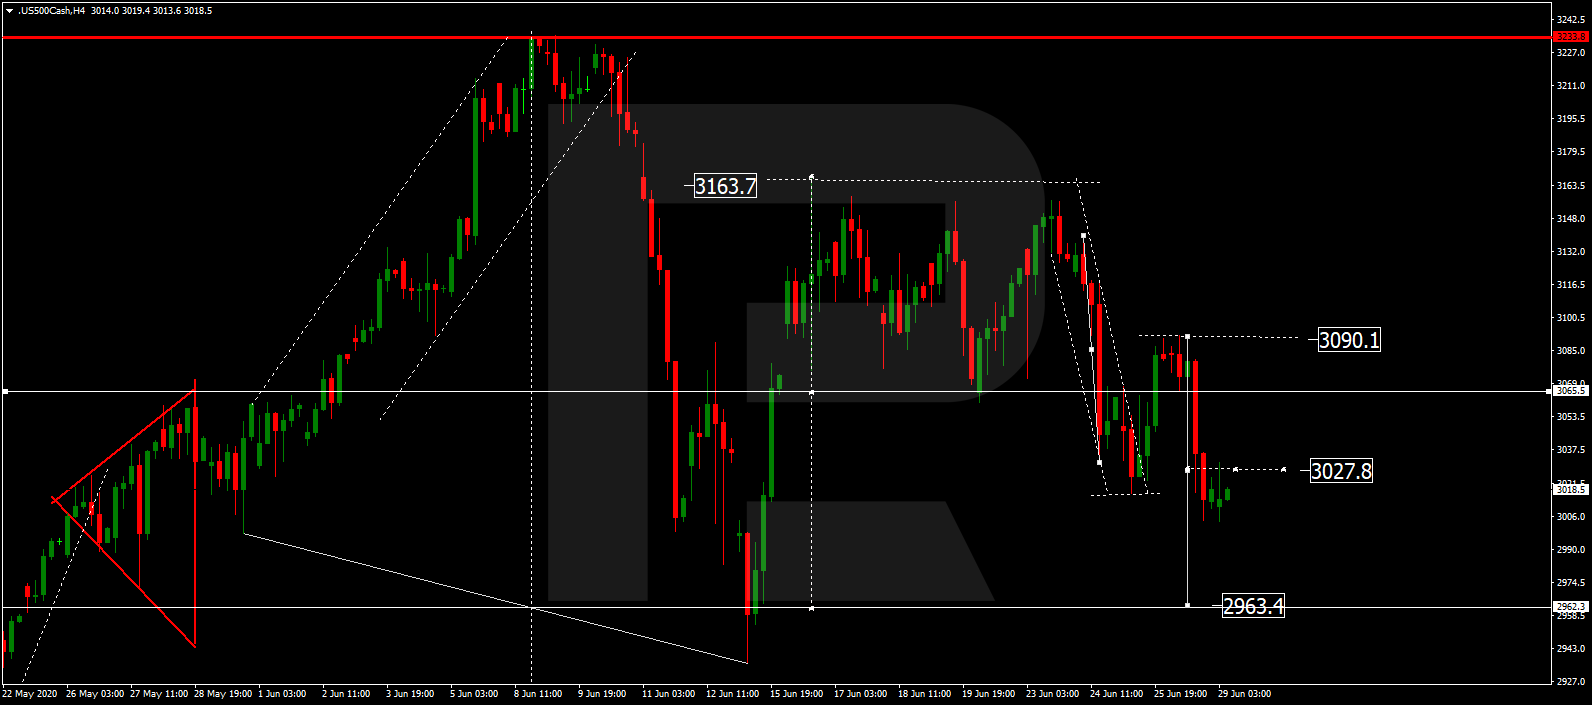
S&P 500

The Index is still falling towards 2963.4. After that, the instrument may form a new consolidation range. If later the price breaks this range to the downside, the market may resume trading inside the downtrend with the short-term predicted target at 2750.5.

S&P 500

Article By RoboForex.com

Attention!
Forecasts presented in this section only reflect the author’s private opinion and should not be considered as guidance for trading. RoboForex LP bears no responsibility for trading results based on trading recommendations described in these analytical reviews.

Oil Looking Down Again

By Dmitriy Gurkovskiy, Chief Analyst at RoboForex

On the last Monday of June, oil is moving downwards quite fast. Brent is under significant pressure and trading at $40.39.

Investors are pretty nervous because of monitoring the number of new COVID-19 cases. First of all, we’re talking about the USA, and it is reviving fears and concerns about the second wave of the coronavirus pandemic. Market players are really afraid of new outbreaks because a possible new wave of the disease may transform into something much more serious and make all the efforts put into stabilizing the global economy useless. If the world is flooded with the second wave, the demand for energies may go down and, as a result, commodity prices may plunge as well.

In the USA, potentially dangerous places right now are Texas, Florida, and Los Angeles.

The latest data from Baker Hughes showed another decline in the number of rigs in the USA. For example, since the beginning of the year, the number of oil rigs has dropped by 70%. Over the last week, the total number of rigs (bot oil and gas) lost 1 unit and now equals 265. It’s the lowest number since May 2009.

In the H4 chart, after finishing the descending impulse at 40.00 and the correction towards 41.74, Brent is expected to consolidate between these two levels. Possibly, the pair may form a Triangle pattern. If later the price breaks this range to the downside, the market may resume moving within the downtrend to reach 39.00 or even deeper, 37.00; if to the upside – form one more ascending structure towards 43.00 or even 45.20. From the technical point of view, this scenario is confirmed by MACD Oscillator: its signal line is moving below 0, thus implying a further decline of the price chart towards 39.00. However, if the line rises and breaks 0, the price chart may start rising to reach 43.00.

As we can see in the H1 chart, after breaking 40.00 to the downside, Brent is expected to fall with the short-term target at 39.00 and then start a new correction to test 39.50 from below. After that, the instrument may start a new decline to reach 37.00. However, this scenario may no longer be valid if the market grows towards 41.90. In this case, the asset may continue trading upwards to reach 43.00. From the technical point of view, this idea is confirmed by Stochastic Oscillator: its signal line is rising directly towards 50. If the line breaks this level, it may continue its ascending movement towards 80.

Disclaimer

Any predictions contained herein are based on the author’s particular opinion. This analysis shall not be treated as trading advice. RoboForex shall not be held liable for the results of the trades arising from relying upon trading recommendations and reviews contained herein.


DAX30 withstands selling pressure into quarterly close – bullish?

By Admiral Markets

Source: Economic Events June 29, 2020 – Admiral Markets’ Forex Calendar

After the weak start into last Thursday with the break below 12,000 points, it looked as if the German index could suffer further losses and drop even further into the quarterly close.

This came after speculations arose that some asset allocators, like pension funds, could take the big gains from the stock market in Q2/2020 and move them into bonds, as Wells Fargo estimates that the rebalance into bonds could be the largest in six years.

But instead, bulls recaptured quickly control and with US equities and here the S&P500 seeing the biggest last hour gain Thursday evening, the DAX not only pushed back above 12,000 points, but also above 12,200 points into its consolidation zone.

While it certainly needs to be seen whether Thursday’s move is sustainable, chances of another stint up to 12,600 points, the pre-weekly highs, and a break higher activating the region around 12,900 points, is definitely on the table after the stable performance of the DAX on Friday.

On the other hand: if we get to see a break below 12,000 points, the technical main focus will be on the region around 11,800 points, a break lower makes a deeper correction possible and could see a re-test of the region around 11,450/500.

Source: Admiral Markets MT5 with MT5-SE Add-on DAX30 CFD Hourly chart (between June 9, 2020, to June 26, 2020). Accessed: June 26, 2020, at 10:00pm GMT

Source: Admiral Markets MT5 with MT5-SE Add-on DAX30 CFD Daily chart (between March 13, 2019, to June 26, 2020). Accessed: June 26, 2020, at 10:00pm GMT – Please note: Past performance is not a reliable indicator of future results, or future performance.

In 2015, the value of the DAX30 CFD increased by 9.56%, in 2016, it increased by 6.87%, in 2017, it increased by 12.51%, in 2018, it fell by 18.26%, in 2019, it increased by 26.44% meaning that after five years, it was up by 34.2%.

Check out Admiral Markets’ most competitive conditions on the DAX30 CFD and start trading on the DAX30 CFD with a low 0.8 point spread offering during the main Xetra trading hours!

Discover the world’s #1 multi-asset platform

Admiral Markets offers professional traders the ability to trade with a custom, upgraded version of MetaTrader 5, allowing you to experience trading at a significantly higher, more rewarding level. Experience benefits such as the addition of the Market Heat Map, so you can compare various currency pairs to see which ones might be lucrative investments, access real-time trading data, and so much more. Click the banner below to start your FREE download of MT5 Supreme Edition!

Download MetaTrader 5 and begin trading today!

Disclaimer: The given data provides additional information regarding all analysis, estimates, prognosis, forecasts or other similar assessments or information (hereinafter “Analysis”) published on the website of Admiral Markets. Before making any investment decisions please pay close attention to the following:

  1. This is a marketing communication. The analysis is published for informative purposes only and are in no way to be construed as investment advice or recommendation. It has not been prepared in accordance with legal requirements designed to promote the independence of investment research, and that it is not subject to any prohibition on dealing ahead of the dissemination of investment research.
  2. Any investment decision is made by each client alone whereas Admiral Markets shall not be responsible for any loss or damage arising from any such decision, whether or not based on the Analysis.
  3. Each of the Analysis is prepared by an independent analyst (Jens Klatt, Professional Trader and Analyst, hereinafter “Author”) based on the Author’s personal estimations.
  4. To ensure that the interests of the clients would be protected and objectivity of the Analysis would not be damaged Admiral Markets has established relevant internal procedures for prevention and management of conflicts of interest.
  5. Whilst every reasonable effort is taken to ensure that all sources of the Analysis are reliable and that all information is presented, as much as possible, in an understandable, timely, precise and complete manner, Admiral Markets does not guarantee the accuracy or completeness of any information contained within the Analysis. The presented figures refer that refer to any past performance is not a reliable indicator of future results.
  6. The contents of the Analysis should not be construed as an express or implied promise, guarantee or implication by Admiral Markets that the client shall profit from the strategies therein or that losses in connection therewith may or shall be limited.
  7. Any kind of previous or modeled performance of financial instruments indicated within the Publication should not be construed as an express or implied promise, guarantee or implication by Admiral Markets for any future performance. The value of the financial instrument may both increase and decrease and the preservation of the asset value is not guaranteed.
  8. The projections included in the Analysis may be subject to additional fees, taxes or other charges, depending on the subject of the Publication. The price list applicable to the services provided by Admiral Markets is publicly available from the website of Admiral Markets.

Leveraged products (including contracts for difference) are speculative in nature and may result in losses or profit. Before you start trading, you should make sure that you understand all the risks.

By Admiral Markets

Stocks Ignoring Economic Data, A Meltdown Is Coming, What Now?

By TheTechnicalTraders 

– Many months ago, our research team suggested any future collapse in the global markets would likely prompt a global capital shift in how capital identifies and is deployed for ROI.  We’ve continued to suggest that the more mature, global economies will become beneficiaries of any massive global collapse event and that capital will actively seek out security and safety while attempt to attain moderate returns.  We suggest reading this past research post on global central banks moves to keep the party rolling.

In 2019, we predicted a major Super-Cycle event would take place on or near August 19, 2019.  We believed this event would prompt a major downside price rotation that would prompt a shift in how capital is deployed throughout the world’s financial markets.  At that time, and still, we believe a long-term price cycle event is taking place which will prompt a deeper price bottom event that will likely complete near August or September 2020.  This raises an interesting setup related to Technical Analysis for skilled traders…

If our analysis is correct, the Q2 and Q3 global economic data will be very distressing and likely prompt a continued downside price contraction in stock price levels and valuations.  The disruption to the global economy has likely shaved 5% to 15% (or more) off total global GDP output for this year.  Still, the US Fed and global central banks have poured more and more capital into the markets attempting to front-run this contraction in the global markets.  We believe this “reprieve” in selling is likely temporary right now.  The broader, longer-term, price cycle we’ve identified it still taking place and will likely prompt a deeper price bottom in the global markets before the end of 2020.

Before you continue, be sure to opt-in to our free market trend signals
before closing this page, so you don’t miss our next special report & signal!

The one aspect of recent buying that we find rather interesting is that the NASDAQ (NQ) is really the only US market sector that is outperforming all the other sectors.  This suggests that the US and global investors are piling into technology, biotech, and other NASDAQ symbols expecting these segments of the US economy to outperform the others.  This is one component of the “capital shift” we have been warning investors about.

When the crisis event begins to unfold, capital (cash) will seek out and identify various opportunities as global markets and regional market segments shift from overvalued to undervalued – from risk to opportunity.  We believe this is happening right now in the NASDAQ (NQ) and we believe the opportunity investors have piled into recently may turn into renewed risk in the near future as Q2 and Q3 economic data pushes reality into the markets.

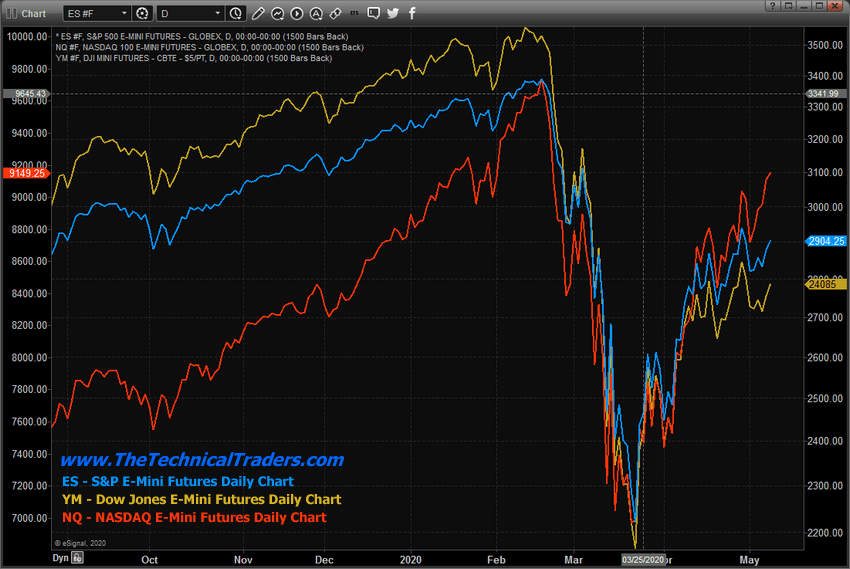
Daily Comparison Chart shows the ES, YM, and NQ

This Daily Comparison Chart shows the ES, YM, and NQ in Log scale and highlights the collapse event for all three major indexes (almost in unison) as well as the incredible upside price rally in the NQ (RED) compared to the ES and YM.  It is fairly easy to see how the NQ (RED Line) rallied over the past 30+ days much more efficiently than the ES and YM levels.  As skilled traders were seeking opportunity, they identified the NQ as the best opportunity to deploy their capital.

Yet, if our analysis is correct and a deeper price low will be necessary to complete the broader price cycle setup that is taking place, this also means the recent opportunity in the NQ may turn into excessive risk if the markets suddenly turn downward – targeting our predicted deeper price bottom.

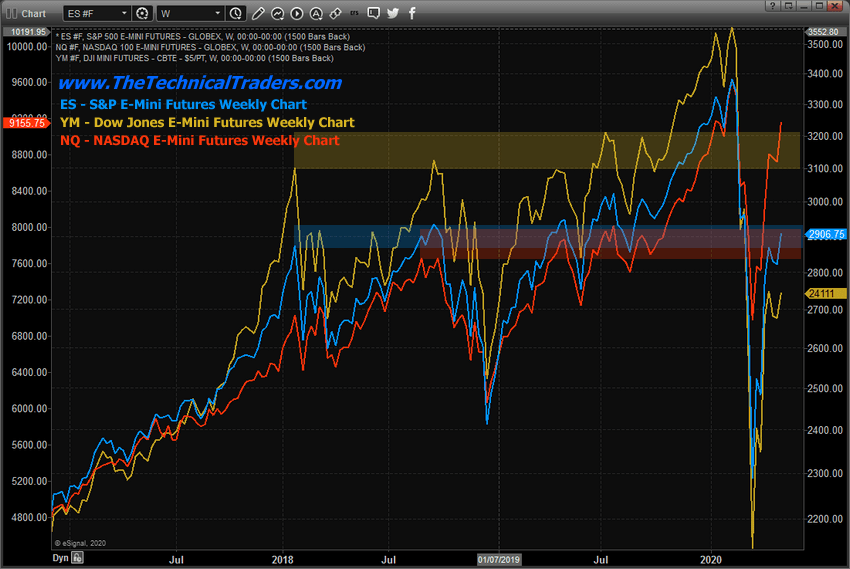
Weekly Comparison Chart shows the ES, YM, and NQ

This Weekly Comparison Chart shows the same three US major indexes and highlights previous price high levels which acted as resistance in the past.  Both the ES and YM are currently trading below these resistance levels.  The NQ is trading well above the resistance level (red).  This continues to suggest that skilled traders have piled into the NQ rally expecting it to continue to outperform the S&P and Dow Jones in the future.

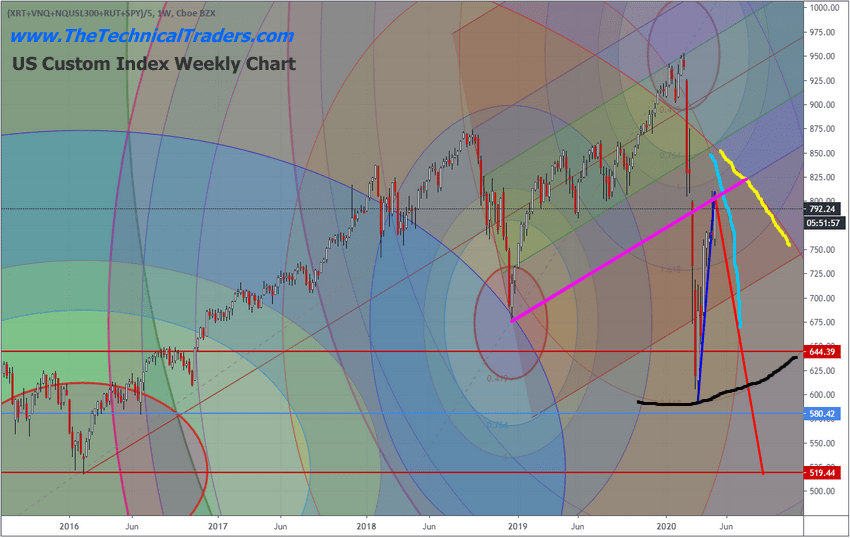
Weekly Custom US Index Chart

This Weekly Custom US Index chart helps to paint a very clear picture of the price trend and support/resistance levels that are active within the markets.  In this chart, you’ll see many aspects of advanced technical analysis that helps us to determine where and when certain types of price action may take place.  One of our tools is the Fibonacci Price Amplitude Arc technique – which attempts to deploy the Fibonacci price theory based on a price trend frequency/amplitude basis.  This means each major and minor price trend (up or down) generates its own frequency/amplitude levels which project out in the past/future as key trigger levels for future price setups (tops/bottoms/rotations).  We’ve also drawn a Std. Deviation Pitchfork across the 2018 top and bottom to highlight 1.0 and 2.0 Std. Deviation ranges related to current price peaks and bottoms.

As you can probably see from the chart, the deep lows in 2020 touched a broad Fibonacci Price Amplitude Arc registering a 2.618 expansion (highlighted in BLACK).  Price has, subsequently, rallied back to the 1.0 StdDev lower price range on the Pitchfork.  Additionally, there is a very important resistance price Arc that is setting up from the December 2018 price lows (highlighted in CYAN).  Lastly, another major price resistance Arc originating from the 2016 lows aligns very closely with current price levels (highlighted in YELLOW).

Our researchers have identified a price inflection date trigger somewhere between May 8th and May 12th which we believe will prompt the start of a new trend or trend reversal trigger.  We believe this inflection point suggests a bigger move will initiate near or shortly after this inflection point date.  These types of inflection points typically result in larger volatility and/or broad price trend moves as they represent price breaking through resistance, support, or some major barrier in price.  The energy it takes to break through these barriers translates into increased volatility and bigger price moves typically.

Chart Courtesy of www.TradingView.com

Currently, because of the technical setups we see that are about to trigger, we are very cautious in terms of taking unwanted risks in the markets related to trades.  These inflection points could prompt a very big upside or downside price move within the next 5+ days and even though we believe the markets will attempt to move lower in a process that completes the deeper downside bottom formation, a “washout high” price rotation may occur as price reaches and breaches this inflection point.

In our view, it is better to wait for the market to confirm trends once this inflection point is processed to determine where the next opportunity for any new trade will present itself.  As we’ve tried to highlight within this article, even though the NQ appears to be rallying back to near all-time highs, the major markets have set up a completely different set of technical analysis outcomes that suggest Q2 and Q3 weakness will likely prompt a deeper bottom pattern in the future.

The one thing we are certain of is that capital has already entered the “capital shift” process we have been suggesting over the past 24+ months.  Capital will continue to roll into and out of various US and global market segments seeking safety, returns, and opportunity while attempting to avoid risks.  We feel the US markets are very close to another topping event based on our research and believe waiting for clarity right now is the best decision skilled traders can make.  One way or another, the market will tell us what to expect after breaking past this inflection point.

This is the start of a significant turning point for stocks and safe havens this week. Enormous patterns have been formed.

Watch this video on how we called the crash months before it happens. We called the 30% rally/bounce, and our new outlook: https://www.thetechnicaltraders.com/sp-500-called-the-crash-30-bounce-now-my-new-prediction/

I love what is happening in the markets for the last few weeks. We want a big bounce and all the bullish emotions that come with it because it will set us up with a substantial long term investment position once price confirms this next entry signal.

If you are using our free public research for your own trading decision-making and/or using it as an opportunity to find and execute successful trades, please remember you are the one ultimately making the decisions to trade based on our interpretation and free research posts.  We, as technical traders, will continue to post new research articles and content that we believe is relevant to the current market setups.

If you want to improve your accuracy and opportunities for success, then we urge you to visit TheTechnicalTraders.com to learn how you can enjoy our research and our members-only trading triggers (see the first chart in this article).  If you are managing your retirement account or 401k, then we urge you to visit www.TheTechnicalInvestor.com to learn how to protect your assets and grow your wealth using our proprietary longer-term modeling systems.  Our goal is to help you find and create success – not to confuse you.

Our researchers will generate free research on just about any topic that interests them.  As technical traders, we follow price, predict future price moves, tops, bottoms, and trends, and attempt to highlight incredible setups that exist on the charts.  What you do with it is up to you.  Visit TheTechnicalTraders.com to review all of our detailed free research posts.

In closing, we would like to suggest that the next 5+ years are going to be incredible opportunities for skilled traders.  Remember, we’ve already mapped out price trends 10+ years into the future that we expect based on our advanced predictive modeling tools.  If our analysis is correct, skilled traders will be able to make a small fortune trading these trends and Metals will skyrocket.  The only way you’ll know which trades to take or not is to become a member.

Chris Vermeulen
Chief Market Strategist
Founder of Technical Traders Ltd.


U.S. Dollar: When Almost Everyone Is Bearish…

By Elliott Wave International

– June started off with speculators decidedly negative toward the U.S. dollar.

On the second day of the month, the Financial Times said:

Wall Street strategists say dollar could be set for “dramatic” falls

Elliott Wave International’s June 10 U.S. Short Term Update, a three-times-a-week publication which provides near-term forecasts for major U.S. financial markets, took note of the bearish sentiment when it showed this chart and said:

The decline from 100.556, the May 14 high, is progressing as an impulse. … Once [the currently unfolding] wave is complete, the U.S. dollar will rally. … Sentiment is rapidly becoming bearish to the extreme. The U.S. dollar DSI (trade-futures.com) is at 22%, nearly matching the 20% that coincided with the March 9 low.

As it turned out, June 10 marked the most recent low in the greenback at 95.716.

Even so, two days later, a June 12 Reuters headline read:

Speculators’ bearish bets on U.S. dollar rise: CFTC, Reuters data

And, talk about bearish – three days after that, a CNBC headline said (June 15):

A dollar crash is virtually inevitable, Asia expert … warns

The article says:

One of the world’s leading authorities on Asia … is worried a changing global landscape paired with a massive U.S. budget deficit will spark a dollar crash.

His forecast calls for a 35% drop against other major currencies.

Yes, it’s true that the U.S. is running a big budget deficit. It’s true that there are still riots in the streets, in parts of the country. It’s true that COVID-19 cases are on the rise, the economy is on the ropes and the unemployment is the highest it’s been since the Great Depression.

But, from Elliott Wave International’s 40-year experience observing and forecasting the markets, our analysts know it’s better to pay attention to the greenback’s Elliott wave structure and other supporting factors rather than “bearish fundamentals.”

Here’s just one example as to why. On April 30, 2011, a Wall Street Journal article cited fundamentals as a reason for the then dollar’s downward slide:

The main drivers of the dollar’s weakness, say economists, are the twin pillars of economic intervention: monetary and fiscal policy. “The market is concerned about the deficit and the Fed,” says [a] fixed-income and foreign-exchange analyst. …

Well, five days after that article published, the buck hit a major bottom and went on to rally for several years!

Getting back to 2020, as of this writing on June 22, the U.S. Dollar Index remains above its June 10 low. Despite all the “bearish fundamentals.”

The June 22 U.S. Short Term Update noted:

The U.S. Dollar Index [has been] rising in a well-defined channel since February of 2018. This channel should remain intact as the index advances.

Speaking of channels, here’s what the Wall Street classic book, Elliott Wave Principle: Key to Market Behavior, says about the topic:

[Ralph N. Elliott, the founder of the Wave Principle,] noted that a parallel trend channel marks the upper and lower boundaries of an impulse wave, often with dramatic precision. You should draw one as early as possible to assist in determining wave targets and provide clues to the future development of trends.

You can learn more about “channeling” by reading the online version of Elliott Wave Principle: Key to Market Behavior for yourself. You can do so – free!

All that’s required is a free Club EWI signup. If you’ve never heard of Club EWI, it’s the largest educational Elliott wave community in the world. Members get free access to a wealth of Elliott wave resources.

Follow the link and you’ll be on your way to expanding your knowledge of the Wave Principle — free: Elliott Wave Principle: Key to Market Behavior.

This article was syndicated by Elliott Wave International and was originally published under the headline U.S. Dollar: When Almost Everyone Is Bearish…. EWI is the world’s largest market forecasting firm. Its staff of full-time analysts led by Chartered Market Technician Robert Prechter provides 24-hour-a-day market analysis to institutional and private investors around the world.

Ichimoku Cloud Analysis 26.06.2020 (BTCUSD, USDCAD, NZDUSD)

Article By RoboForex.com

BTCUSD, “Bitcoin vs US Dollar”

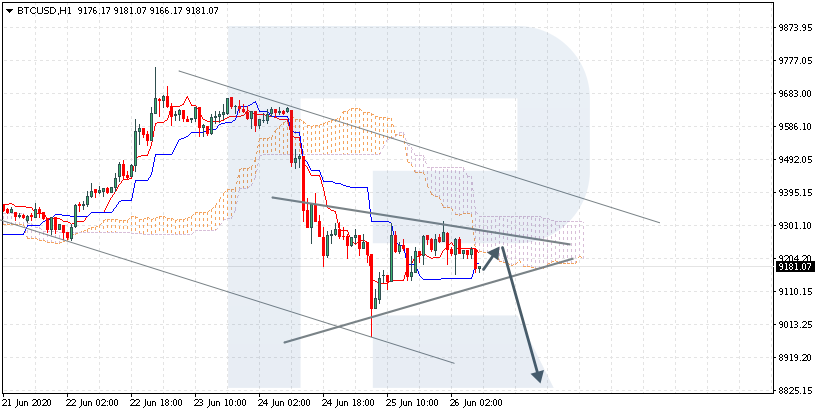
BTCUSD is trading at 9180.00; the instrument is moving below Ichimoku Cloud, thus indicating a descending tendency. The markets could indicate that the price may test the cloud’s downside border at 9205.00 and then resume moving downwards to reach 8835.00. Another signal in favor of further downtrend will be a rebound from the upside border of the Triangle pattern. However, the bearish scenario may no longer be valid if the price breaks the cloud’s upside border and fixes above 9325.00. In this case, the pair may continue growing towards 9605.00. To confirm further decline, the asset must break the Triangle’s downside border and fix below 9005.00.

BTCUSD
Risk Warning: the result of previous trading operations do not guarantee the same results in the future

USDCAD, “US Dollar vs Canadian Dollar”

USDCAD is trading at 1.3637; the instrument is moving above Ichimoku Cloud, thus indicating an ascending tendency. The markets could indicate that the price may test the cloud’s upside border at 1.3625 and then resume moving upwards to reach 1.3705. Another signal in favor of further uptrend will be a rebound from the support level. However, the bullish scenario may no longer be valid if the price breaks the cloud’s downside border and fixes below 1.3555. In this case, the pair may continue falling towards 1.3465.

USDCAD
Risk Warning: the result of previous trading operations do not guarantee the same results in the future

NZDUSD, “New Zealand Dollar vs US Dollar”

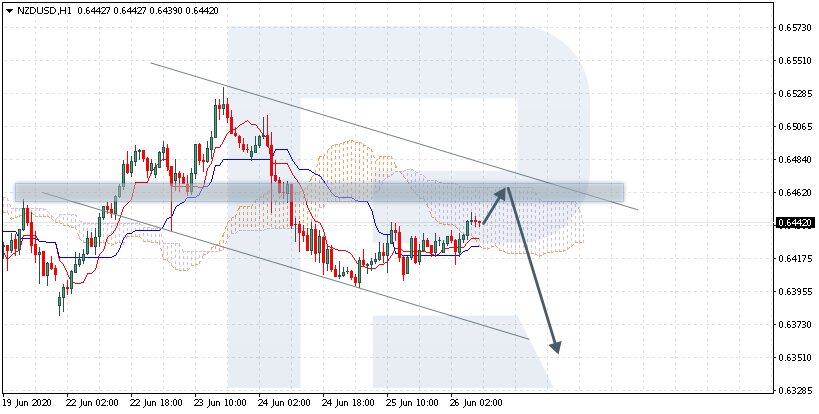
NZDUSD is trading at 0.6442; the instrument is moving inside Ichimoku Cloud, thus indicating a sideways tendency. The markets could indicate that the price may test the cloud’s upside border at 0.6425 and then resume moving downwards to reach 0.6350. Another signal in favor of further downtrend will be a rebound from the descending channel’s upside border. However, the bearish scenario may be canceled if the price breaks the cloud’s upside border and fixes above 0.6505. In this case, the pair may continue growing towards 0.6595. To confirm further decline, the asset must break the cloud’s downside border and fix below 0.6405.

NZDUSD
Risk Warning: the result of previous trading operations do not guarantee the same results in the future

Article By RoboForex.com

Attention!
Forecasts presented in this section only reflect the author’s private opinion and should not be considered as guidance for trading. RoboForex LP bears no responsibility for trading results based on trading recommendations described in these analytical reviews.

Fibonacci Retracements Analysis 26.06.2020 (BITCOIN, ETHEREUM)

Article By RoboForex.com

BTCUSD, “Bitcoin vs US Dollar”

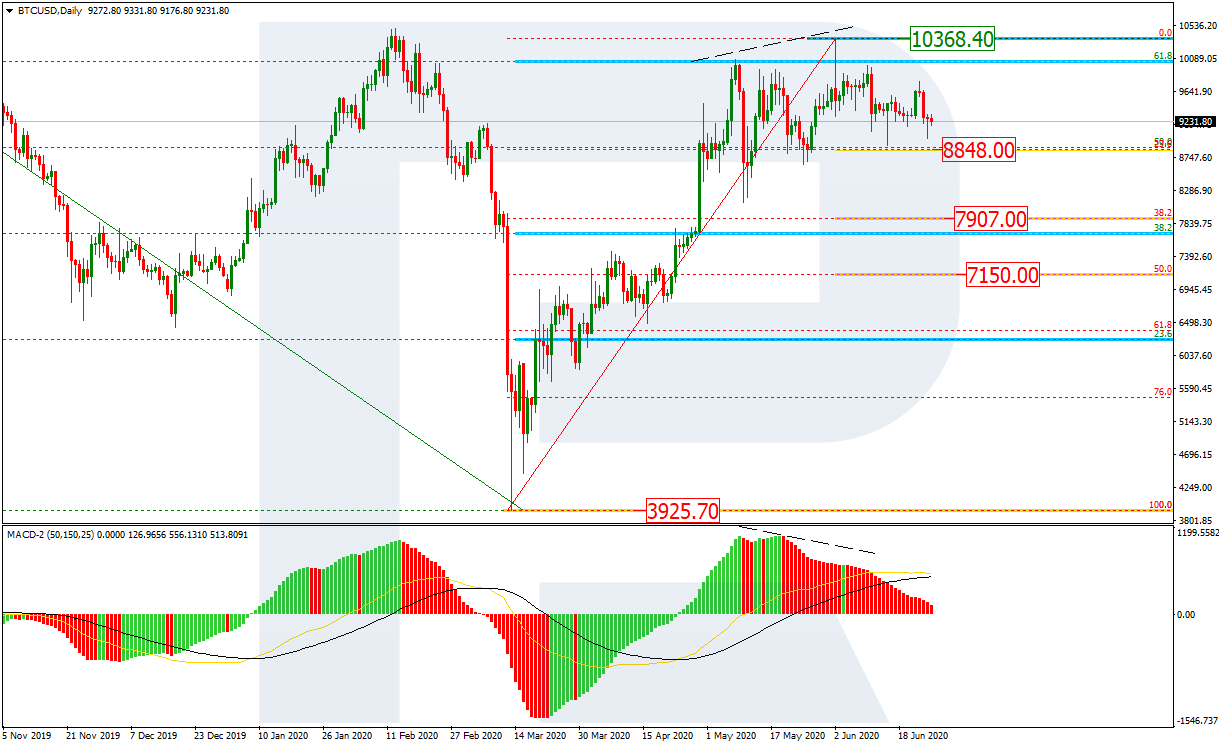
In the daily chart, the situation has remained unchanged for quite a long time. After Bitcoin reached the mid-term 61.8% fibo, there was a divergence but the price failed to start a new downtrend. All attempts to grow are facing strong bearish pressure. The asset is still trading between the high (10368.40) and the first correctional target, which is 23.6% fibo at 8848.00. If the instrument breaks this level, it may continue falling towards the next targets – 38.2% and 50.0% fibo at 7907.00 and 7150.00 respectively.

BITCOIN
Risk Warning: the result of previous trading operations do not guarantee the same results in the future

As we can see in the H4 chart, after completing the local rising correction, the pair has finished the descending impulse towards 23.6% fibo at 8848.00.

BTCUSD
Risk Warning: the result of previous trading operations do not guarantee the same results in the future

ETHUSD, “Ethereum vs. US Dollar”

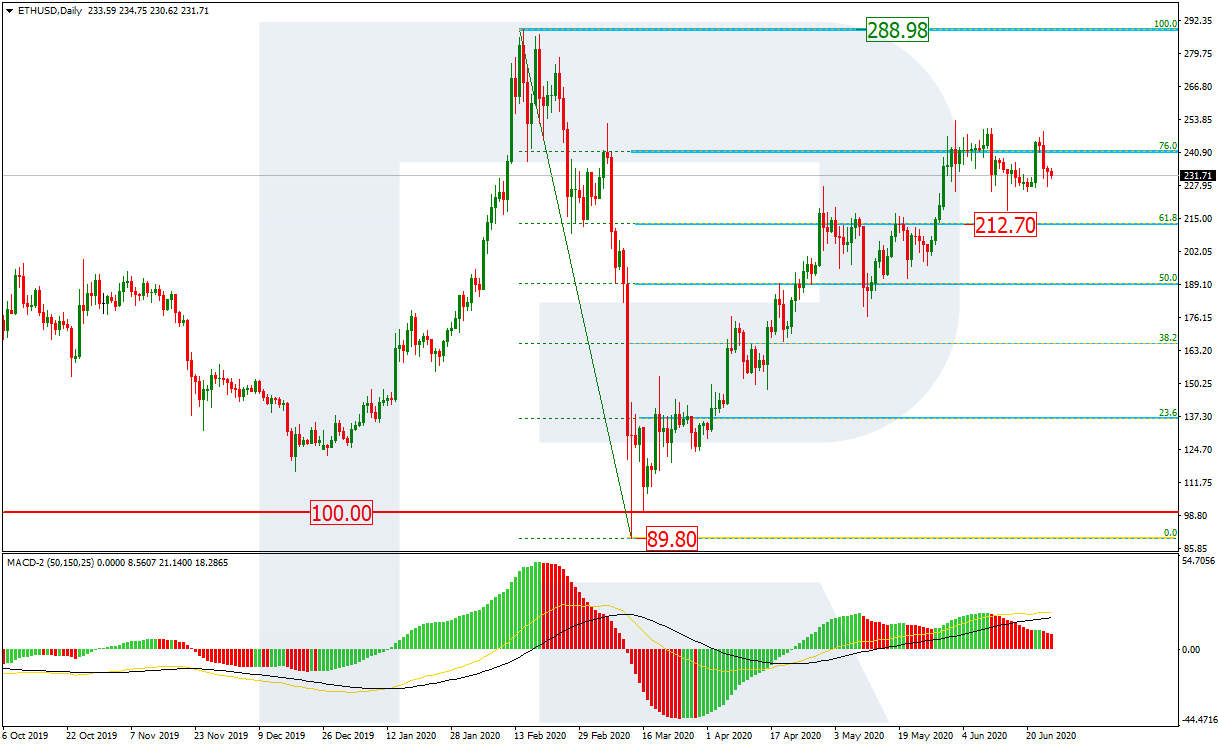
As we can see in the daily chart, Ethereum moving close to 76.0% fibo. Earlier, the asset tried to resume moving downwards but failed to break the support at 61.8% fibo at 212.70. The bearish scenario remains more probably but once shouldn’t exclude the possibility of further growth towards the fractal high at 288.98.

ETHEREUM
Risk Warning: the result of previous trading operations do not guarantee the same results in the future

The H4 chart shows a more detailed structure of the current descending wave after an attempt to test the high at 253.47. The downside target may be 23.6%, 38.2%, and 50.0% fibo at 214.90, 191.00, and 171.60 respectively.

ETHUSD

Article By RoboForex.com

Attention!
Forecasts presented in this section only reflect the author’s private opinion and should not be considered as guidance for trading. RoboForex LP bears no responsibility for trading results based on trading recommendations described in these analytical reviews.

Will Friday’s data from the US set the stage for 1.1400 in the EUR/USD?

By Admiral Markets

Source: Economic Events June 26, 2020 – Admiral Markets’ Forex Calendar

After the EUR/USD re-tested the region around 1.1150/1200, the Euro took on bullish momentum again, quickly recapturing 1.1300.

A potential driver for this comes from recent unexpected European economic indications over the last few days, such as the Manufacturing PMI for France last Tuesday increasing to 52.1 for June, beating market forecasts of 46 and pointing to the biggest expansion in the manufacturing sector since September of 2018. There also was the German ifo Business Climate indicator last Wednesday, rising by 6.5 points from the previous month to a four-month high of 86.2, beating market expectations 85.0 and pointing to the largest monthly increase in the index ever.

While we certainly remain cautious in regards to the sustainability of these numbers after the Corona lockdown, the overall picture in the Euro against the US dollar stays definitely positive with the focus on the upside around 1.1400/50.

For the weekly close, US economic projections will be our focus, particularly regarding Personal Spending and Personal Income.

What will also be of interest is whether the tendency over the last weeks and the Citi US Economic Surprise Index hitting record high after record, continues.

If not, and 10-year US yields see another attempt to break below 0.60%, EUR/USD will likely see a deep green weekly close, bringing the region around 1.1400/50 into our focus into the end of the Q2 2020:

Source: Admiral Markets MT5 with MT5-SE Add-on EUR/USD Daily chart (between April 26, 2019, to June 25, 2020). Accessed: June 25, 2020, at 10:00pm GMT – Please note: Past performance is not a reliable indicator of future results, or future performance.

In 2015, the value of the EUR/USD fell by 10.2%, in 2016, it fell by 3.2%, in 2017, it increased by 13.92%, 2018, it fell by 4.4%, 2019, it fell by 2.2%, meaning that after five years, it was down by 7.3%.

Discover the world’s #1 multi-asset platform

Admiral Markets offers professional traders the ability to trade with a custom, upgraded version of MetaTrader 5, allowing you to experience trading at a significantly higher, more rewarding level. Experience benefits such as the addition of the Market Heat Map, so you can compare various currency pairs to see which ones might be lucrative investments, access real-time trading data, and so much more. Click the banner below to start your FREE download of MT5 Supreme Edition!

Download MetaTrader 5 and begin trading today!

Disclaimer: The given data provides additional information regarding all analysis, estimates, prognosis, forecasts or other similar assessments or information (hereinafter “Analysis”) published on the website of Admiral Markets. Before making any investment decisions please pay close attention to the following:

  1. This is a marketing communication. The analysis is published for informative purposes only and are in no way to be construed as investment advice or recommendation. It has not been prepared in accordance with legal requirements designed to promote the independence of investment research, and that it is not subject to any prohibition on dealing ahead of the dissemination of investment research.
  2. Any investment decision is made by each client alone whereas Admiral Markets shall not be responsible for any loss or damage arising from any such decision, whether or not based on the Analysis.
  3. Each of the Analysis is prepared by an independent analyst (Jens Klatt, Professional Trader and Analyst, hereinafter “Author”) based on the Author’s personal estimations.
  4. To ensure that the interests of the clients would be protected and objectivity of the Analysis would not be damaged Admiral Markets has established relevant internal procedures for prevention and management of conflicts of interest.
  5. Whilst every reasonable effort is taken to ensure that all sources of the Analysis are reliable and that all information is presented, as much as possible, in an understandable, timely, precise and complete manner, Admiral Markets does not guarantee the accuracy or completeness of any information contained within the Analysis. The presented figures refer that refer to any past performance is not a reliable indicator of future results.
  6. The contents of the Analysis should not be construed as an express or implied promise, guarantee or implication by Admiral Markets that the client shall profit from the strategies therein or that losses in connection therewith may or shall be limited.
  7. Any kind of previous or modeled performance of financial instruments indicated within the Publication should not be construed as an express or implied promise, guarantee or implication by Admiral Markets for any future performance. The value of the financial instrument may both increase and decrease and the preservation of the asset value is not guaranteed.
  8. The projections included in the Analysis may be subject to additional fees, taxes or other charges, depending on the subject of the Publication. The price list applicable to the services provided by Admiral Markets is publicly available from the website of Admiral Markets.

Leveraged products (including contracts for difference) are speculative in nature and may result in losses or profit. Before you start trading, you should make sure that you understand all the risks.

By Admiral Markets