Author Archive for InvestMacro – Page 18

A Reason to be “Extra-Attentive” to Stock Market Sentiment Measures

By Elliott Wave International

– Extreme investor sentiment, whether bullish or bearish, is often a sign that a financial market is on the cusp of a turn.

Here’s the reason: When almost everyone is bullish (or bearish), there’s almost no one left to push the market higher (or lower).

Having said that, an extreme market sentiment can become even more extreme before a trend change occurs. So, an investor should not rely solely on sentiment measures when making portfolio decisions. In other words, sentiment measures should be put into context with technical indicators, the Elliott wave model and other factors which an Elliott wave expert may consider important.

Indeed, Elliott Wave International’s Chief Market Analyst recently discussed the elevated optimism since the March stock market lows and also noted an important caveat.

Here’s a chart and commentary from EWI’s June 24 U.S. Short Term Update (a thrice weekly publication which provides near-term forecasts for major U.S. financial markets):

This week’s release of the Investors Intelligence Advisors’ survey shows another measure where optimism is now higher than it was at the February 12-19 stock market peak in the blue-chip indexes. The percentage of bullish advisors is up to 57.3%, the highest total since January 21, as denoted by the red arrows on the chart. By the end of March, the Dow was 38% lower. Extreme sentiment can remain extreme, so it’s not an automatic reason to be bearish the market. But the fact that advisor optimism is increasing while nearly every stock index is declining, save the NASDAQ, is a reason to be extra-attentive.

Yes, there are even more measures of extreme elevated sentiment that investors need to know about.

That issue of the June 24 U.S. Short Term Update also referred to record levels of investor optimism in Small Trader call buying, the total number of DARTs at the two largest U.S. discount brokerage firms, and the off-the-chart exuberance by institutional investors in the amount raised for blank-check IPOs.

Plus, here are two recent headlines:

  • Wall Street rally wins more fans as economy hints at recovery (Reuters, June 17)
  • What’s Next? Probing The Data For Clues As Market Sentiment Remains Bullish (Forbes, June 17)

Well, the stock market’s Elliott wave pattern, plus the extreme bullish sentiment, provide a high-confidence answer to the question of “What’s next?”

Learn more about the Elliott wave model by reading the online version of the book, Elliott Wave Principle: Key to Market Behavior.

You can enjoy free access to this Wall Street classic when you join Club EWI, the world’s largest Elliott wave educational community. Club membership is also free.

Follow this link to get started: Elliott Wave Principle: Key to Market Behavior — free.

Fibonacci Retracements Analysis 01.07.2020 (GBPUSD, EURJPY)

Article By RoboForex.com

GBPUSD, “Great Britain Pound vs US Dollar”

The H4 chart shows a new descending correction after the divergence on MACD. By now, GBPUSD has already reached 38.2% fibo. The local convergence is pushing the pair upwards for a short-term pullback. After completing the pullback, the market may resume falling towards 50.0% and 61.8% fibo at 1.2111 and 1.1946 respectively. The resistance is the high at 1.2813.

GBPUSD_H4
Risk Warning: the result of previous trading operations do not guarantee the same results in the future

The H1 chart shows the first rising impulse within a short-term correction, which has already reached 23.6% fibo. Later, it may continue moving towards 38.2% and 50.0% fibo at 1.2466 and 1.2532 respectively. If the price breaks the support at 1.2252, the instrument may continue the mid-term downtrend.

GBPUSD_H1
Risk Warning: the result of previous trading operations do not guarantee the same results in the future

EURJPY, “Euro vs. Japanese Yen”

As we can see in the H4 chart, after completing the descending wave at 50.0% fibo, EURJPY is finishing the ascending correction. The next descending impulse may be heading towards 61.8% fibo at 118.79. After finishing the pullback, the instrument may start a new rising wave towards the mid-term 50.0% fibo at 125.94 but only after breaking the high at 124.43.

EURJPY_H4
Risk Warning: the result of previous trading operations do not guarantee the same results in the future

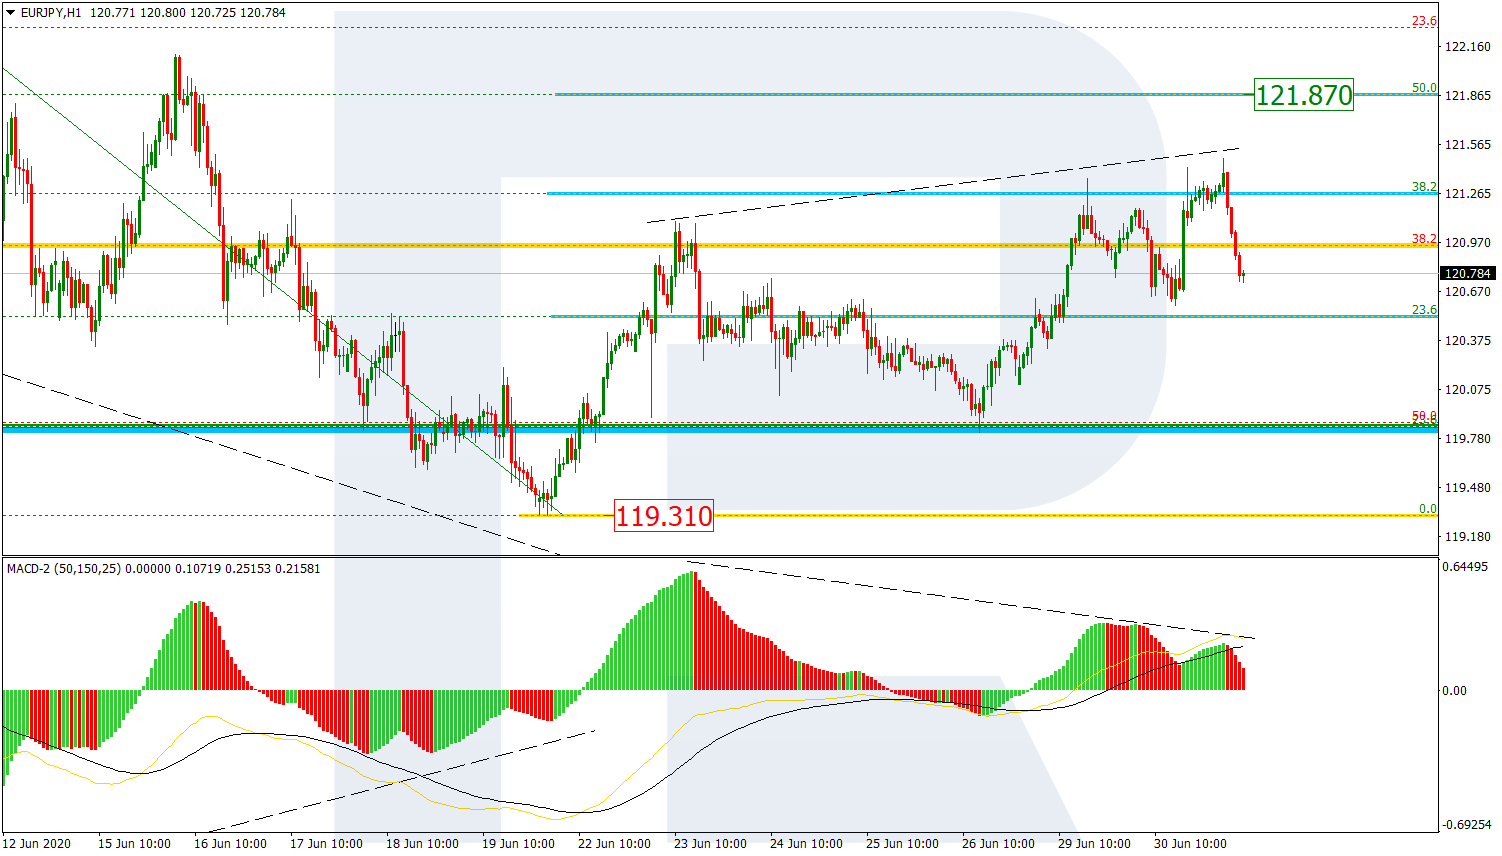
The H1 chart shows a more detailed structure of the correctional uptrend. After reaching 38.2% fibo, the correction may continue towards 50.0% fibo at 121.86. However, the local divergence may indicate that the correction may slow down and be over soon. If the price breaks the low at 119.31, it may resume the descending tendency.

EURJPY_H1

Article By RoboForex.com

Attention!
Forecasts presented in this section only reflect the author’s private opinion and should not be considered as guidance for trading. RoboForex LP bears no responsibility for trading results based on trading recommendations described in these analytical reviews.

Forex Technical Analysis & Forecast 01.07.2020

Article By RoboForex.com

EURUSD, “Euro vs US Dollar”

After completing another correctional structure at 1.1260, EURUSD is falling towards 1.1215. Possibly, today the pair may reach this level and then form a new consolidation range around it. If later the price breaks this range to the downside, the market may continue trading downwards with the short-term target at 1.1170. After that, the instrument may correct to test 1.1215 from below and then form a new descending structure to reach 1.1144.

EURUSD
Risk Warning: the result of previous trading operations do not guarantee the same results in the future

GBPUSD, “Great Britain Pound vs US Dollar”

After breaking 1.2300 upwards, GBPUSD has completed another ascending wave at 1.2370, which may be considered as a correction. Today, the pair may consolidate around 1.2370. If later the price breaks this range to the downside at 1.2350, the market may resume trading downwards to break 1.2300 and then continue falling inside the downtrend with the target at 1.2200.

GBPUSD
Risk Warning: the result of previous trading operations do not guarantee the same results in the future

USDRUB, “US Dollar vs Russian Ruble”

After extending the ascending structure up to 71.31, USDRUB is expected to correct towards 69.69. After that, the instrument may resume trading upwards to reach 71.81 and then start another decline with the target at 68.00.

USDRUB
Risk Warning: the result of previous trading operations do not guarantee the same results in the future

USDJPY, “US Dollar vs Japanese Yen”

After reaching another upside target at 108.15, USDJPY is expected to fall towards 107.50. Later, the market may form one more ascending structure to reach 108.22, thus forming the third ascending wave within the correction.

USDJPY
Risk Warning: the result of previous trading operations do not guarantee the same results in the future

USDCHF, “US Dollar vs Swiss Franc”

After forming another consolidation range around 0.9515 and breaking it to the downside, USDCHF has reached 0.9460; right now, it is forming a new range above this level. Possibly, the pair may resume trading upwards to break 0.9540 and then continue growing within the uptrend with the target at 0.9660.

USDCHF
Risk Warning: the result of previous trading operations do not guarantee the same results in the future

AUDUSD, “Australian Dollar vs US Dollar”

After rebounding from 0.6832, AUDUSD has completed the ascending structure at 0.6900. Today, the pair may start a new decline to break 0.6850 and then continue trading downwards with the target at 0.6787.

AUDUSD
Risk Warning: the result of previous trading operations do not guarantee the same results in the future

BRENT

Brent is consolidating around 40.70 within a Triangle pattern. Possibly, today the pair may test 40.70 from above, rebound from it, and then resume trading upwards to break 42.20. Later, the market may continue growing with the target at 43.80. However, there might be another scenario, according to which the price may break 40.70 to the downside and then continue the correction to reach 37.70.

BRENT
Risk Warning: the result of previous trading operations do not guarantee the same results in the future

XAUUSD, “Gold vs US Dollar”

After breaking 1775.00, Gold has reached 1785.50. Today, the pair may form a new descending structure to return to 1775.50 and then start another growth with the target at 1791.55 or even 1800.00.

GOLD
Risk Warning: the result of previous trading operations do not guarantee the same results in the future

BTCUSD, “Bitcoin vs US Dollar”

BTCUSD is still consolidating around 9100.00. Possibly, today the pair may start another growth to reach 9280.00 and then resume trading downwards with the target at 8700.00. Later, the market may correct towards 9200.00..

BITCOIN
Risk Warning: the result of previous trading operations do not guarantee the same results in the future

S&P 500

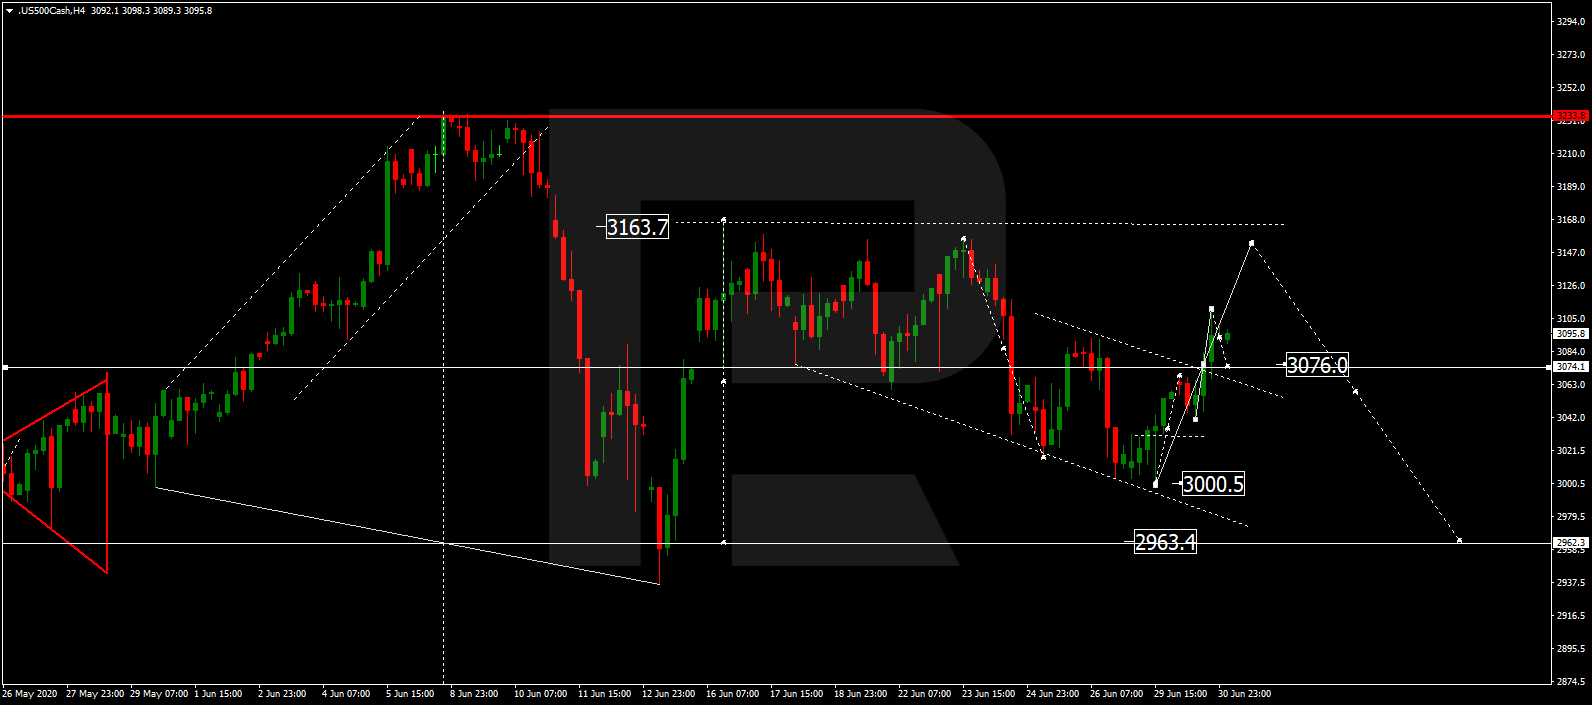
After attempting to break 3076.0 to the upside, the Index is expected to continue growing towards 3145.5 or even 3233.3. After that, the instrument may resume trading inside the downtrend with the target at 3075.5.

S&P 500

Article By RoboForex.com

Attention!
Forecasts presented in this section only reflect the author’s private opinion and should not be considered as guidance for trading. RoboForex LP bears no responsibility for trading results based on trading recommendations described in these analytical reviews.

The Analytical Overview of the Main Currency Pairs on 2020.07.01

by JustForex

The EUR/USD currency pair

Technical indicators of the currency pair:
  • Prev Open: 1.12361
  • Open: 1.12337
  • % chg. over the last day: -0.02
  • Day’s range: 1.12154 – 1.12448
  • 52 wk range: 1.0777 – 1.1494

The EUR/USD currency pair continues to consolidate. The technical pattern is ambiguous. At the moment, the local support and resistance levels are 1.1215 and 1.1250, respectively. Financial market participants have taken a wait-and-see attitude before the publication of the FOMC meeting minutes, as well as important economic releases from Germany and the US. Yesterday, the Fed Chairman Jerome Powell said that the second wave of COVID-19 outbreak could force the government and people to halt their economic activity again. Positions should be opened from key levels.

The Economic News Feed for 2020.07.01:
  • – A number of indicators on economic activity in Germany and the Eurozone at 10:55 (GMT+3:00) and 11:00 (GMT+3:00), respectively;
  • – ISM manufacturing PMI at 17:00 (GMT+3:00);
  • – Publication of the FOMC meeting minutes at 21:00 (GMT+3:00).
EUR/USD

Indicators do not give accurate signals: 50 MA has crossed 100 MA.

The MACD histogram is near the 0 mark.

Stochastic Oscillator is in the neutral zone, the %K line is above the %D line, which gives a signal to buy EUR/USD.

Trading recommendations
  • Support levels: 1.1215, 1.1190, 1.1170
  • Resistance levels: 1.1250, 1.1285, 1.1310

If the price fixes below 1.1215, EUR/USD quotes are expected to fall. The movement is tending to 1.1180-1.1160.

An alternative could be the growth of the EUR/USD currency pair to 1.1280-1.1300.

The GBP/USD currency pair

Technical indicators of the currency pair:
  • Prev Open: 1.22995
  • Open: 1.23965
  • % chg. over the last day: +0.83
  • Day’s range: 1.23592 – 1.24138
  • 52 wk range: 1.1466 – 1.3516

GBP/USD quotes have been growing. The British pound has updated local highs. Currently, the GBP/USD currency pair is consolidating. The key range is 1.2360-1.2415. The technical pattern signals the further growth of trading instrument. We expect the publication of important economic reports from the UK and the US. Investors are still concerned about the start of a new wave of the coronavirus epidemic. Positions should be opened from key levels.

GBP/USD

Indicators do not give accurate signals: the price has fixed between 50 MA and 100 MA.

The MACD histogram is in the positive zone, but below the signal line, which gives a weak signal to buy GBP/USD.

Stochastic Oscillator is in the neutral zone, the %K line is above the %D line, which indicates the development of bullish sentiment.

Trading recommendations
  • Support levels: 1.2360, 1.2315, 1.2260
  • Resistance levels: 1.2415, 1.2455, 1.2500

If the price fixes above 1.2415, further growth of GBP/USD quotes is expected. The movement is tending to 1.2450-1.2480.

An alternative could be a decrease in the GBP/USD currency pair to 1.2330-1.2300.

The USD/CAD currency pair

Technical indicators of the currency pair:
  • Prev Open: 1.36588
  • Open: 1.35753
  • % chg. over the last day: -0.61
  • Day’s range: 1.35456 – 1.35861
  • 52 wk range: 1.2949 – 1.4668

There are aggressive sales on the USD/CAD currency pair. The loonie has ignored Canada’s weak GDP report. During yesterday’s and today’s trading sessions, the Canadian dollar has added more than 100 points in price against the greenback. The loonie is currently consolidating in the range of 1.3550-1.3585. USD/CAD quotes have the potential for further decline. Positive dynamics of “black gold” prices support the Canadian dollar. Positions should be opened from key levels.

The news feed on Canada’s economy is calm today.

USD/CAD

Indicators signal the power of sellers: the price has fixed below 100 MA.

The MACD histogram is in the negative zone, indicating the bearish sentiment.

Stochastic Oscillator is in the neutral zone, the %K line is below the %D line, which also gives a signal to sell USD/CAD.

Trading recommendations
  • Support levels: 1.3550, 1.3525, 1.3490
  • Resistance levels: 1.3585, 1.3615

If the price fixes below 1.3550, a further drop in USD/CAD quotes is expected. The movement is tending to 1.3525-1.3490.

An alternative could be the growth of the USD/CAD currency pair to 1.3610-1.3640.

The USD/JPY currency pair

Technical indicators of the currency pair:
  • Prev Open: 107.563
  • Open: 107.920
  • % chg. over the last day: +0.34
  • Day’s range: 107.468 – 108.163
  • 52 wk range: 101.19 – 112.41

The USD/JPY currency pair has been declining. At the moment, the trading instrument is testing a “mirror” support level of 107.45. The 107.80 mark is the nearest resistance. USD/JPY quotes have the potential for further decline. Today we recommend paying attention to economic releases from the US. Positions should be opened from key levels.

During the Asian trading session, weak economic data from Tankan have been published.

USD/JPY

Indicators do not give accurate signals: the price has crossed 50 MA.

The MACD histogram has started declining, which indicates the development of bearish sentiment.

Stochastic Oscillator is in the oversold zone, the %K line has crossed the %D line. There are no signals at the moment.

Trading recommendations
  • Support levels: 107.45, 107.05, 106.80
  • Resistance levels: 107.80, 108.10

If the price fixes below 107.45, a further drop in USD/JPY quotes is expected. The movement is tending to the round level of 107.00.

An alternative could be the growth of the USD/JPY currency pair to 108.00-108.20.

by JustForex

Gold finally driven above 1,800 USD by ISM Manufacturing?

By Admiral Markets

Source: Economic Events June 29, 2020 – Admiral Markets’ Forex Calendar

While Gold bulls have failed to gain any further bullish momentum to break above 1,800 USD (the region of 2012’s yearly highs) in order to push the precious metal to its highest levels in eight years, the picture in Gold stays bullish.

One potential catalyst for a break higher, and above, 1,800 USD could come from the upcoming US economic projections, especially the ISM Manufacturing PMI’s.

In fact, a disappointing print could finally result in a break below 0.60% in 10-year US yields, and we think that the only reason that a break lower could be avoided is most likely due to the solid US economic projections over the last few weeks, as well as the Citi US Economic Surprise Index hitting record high after record high.

Our interpretation is that Gold bulls are probably anticipating another wave down in terms of economic projections, but also a Fed which will soon increase its balance sheet again after its ‘short-term taper’ over the course of the last two weeks.

That may become especially true if volatility in Equities picks up once again, similar to the heavier volatility after the Fed on June 11.

Such an increase could act as a very bullish driver for Gold, levelling the path rather sooner than later up to the current All Time High around 1,920 USD.

Technically the mode on a daily time-frame in Gold stays bullish as long as we trade above 1,660 USD:

Source: Admiral Markets MT5 with MT5-SE Add-on Gold Daily chart (between April 1, 2019, to June 30, 2020). Accessed: June 30, 2020, at 10:00pm GMT – Please note: Past performance is not a reliable indicator of future results, or future performance.

In 2015, the value of Gold fell by 10.4%, in 2016 it increased by 8.1%, in 2017 it increased by 13.1%, in 2018, it fell by 1.6%, in 2019, it increased by 18.9%, meaning that after five years, it was up by 28%.

Discover the world’s #1 multi-asset platform

Admiral Markets offers professional traders the ability to trade with a custom, upgraded version of MetaTrader 5, allowing you to experience trading at a significantly higher, more rewarding level. Experience benefits such as the addition of the Market Heat Map, so you can compare various currency pairs to see which ones might be lucrative investments, access real-time trading data, and so much more. Click the banner below to start your FREE download of MT5 Supreme Edition!

Download MetaTrader 5 and begin trading today!

Disclaimer: The given data provides additional information regarding all analysis, estimates, prognosis, forecasts or other similar assessments or information (hereinafter “Analysis”) published on the website of Admiral Markets. Before making any investment decisions please pay close attention to the following:

  1. This is a marketing communication. The analysis is published for informative purposes only and are in no way to be construed as investment advice or recommendation. It has not been prepared in accordance with legal requirements designed to promote the independence of investment research, and that it is not subject to any prohibition on dealing ahead of the dissemination of investment research.
  2. Any investment decision is made by each client alone whereas Admiral Markets shall not be responsible for any loss or damage arising from any such decision, whether or not based on the Analysis.
  3. Each of the Analysis is prepared by an independent analyst (Jens Klatt, Professional Trader and Analyst, hereinafter “Author”) based on the Author’s personal estimations.
  4. To ensure that the interests of the clients would be protected and objectivity of the Analysis would not be damaged Admiral Markets has established relevant internal procedures for prevention and management of conflicts of interest.
  5. Whilst every reasonable effort is taken to ensure that all sources of the Analysis are reliable and that all information is presented, as much as possible, in an understandable, timely, precise and complete manner, Admiral Markets does not guarantee the accuracy or completeness of any information contained within the Analysis. The presented figures refer that refer to any past performance is not a reliable indicator of future results.
  6. The contents of the Analysis should not be construed as an express or implied promise, guarantee or implication by Admiral Markets that the client shall profit from the strategies therein or that losses in connection therewith may or shall be limited.
  7. Any kind of previous or modeled performance of financial instruments indicated within the Publication should not be construed as an express or implied promise, guarantee or implication by Admiral Markets for any future performance. The value of the financial instrument may both increase and decrease and the preservation of the asset value is not guaranteed.
  8. The projections included in the Analysis may be subject to additional fees, taxes or other charges, depending on the subject of the Publication. The price list applicable to the services provided by Admiral Markets is publicly available from the website of Admiral Markets.

Leveraged products (including contracts for difference) are speculative in nature and may result in losses or profit. Before you start trading, you should make sure that you understand all the risks.

By Admiral Markets

Combating climate change – why investors should keep their shares in fossil fuel companies

By Adrian R. Bell, University of Reading and Chris Brooks, University of Reading

As we begin to engage with the climate emergency and the impact of carbon dioxide emissions, calls have grown to stop investing in companies engaged in fossil fuel production – a practice known as divestment.

The University of Oxford became one of the latest institutional investors to pledge to drop all fossil fuel companies from their £3 billion endowment. Enormous pressure from students and staff alike has been put on other universities to follow suit, creating a culture of shame on those that continue to hold these shares.

Many scholars in the UK may be horrified to hear that one of the largest university pension schemes, the University Superannuation Scheme (or USS) has the oil company Shell as its largest holding of £500 million. Recent changes to the USS investment strategy ended its investment in a number of controversial holdings, including tobacco manufacturing, coal mining, cluster munitions (a form of explosive) and landmines. But USS continues to invest in a number of fossil fuel companies saying they intend to engage with them as a “force for good”.

So long as they do wield this influence, we believe this is the right approach for investors who want to combat climate change. Many of those lobbying for divestment will have good intentions. Divesting from fossil fuel companies is likely to make investors feel morally cleansed, having washed their hands of dirty investments that make profits from environmental damage. But it may act as a diversion tactic, allowing the lobbyists and investors who follow their lead to feel good about themselves. And yet they will have done little to combat climate change.

Divestment, leading to the selling of fossil fuel company shares, should put downward pressure on the share price, making it harder for the company to raise new capital. But for the majority of them, even in the face of substantial divestments, it will be very much business as usual, having no effect at all on their day-to-day operations.

If more people want to sell shares than buy them, this will affect the share price – but most oil companies are well beyond the situation where it would cause them significant issues. Neither BP nor Shell, for example, are likely to need to raise new financing in the foreseeable future as they have large cash reserves. Both have share repurchase schemes, where they are able to use dips in their share prices to buy their own shares back, allowing investors to benefit without paying taxable dividends.

But if a company’s shares become sufficiently cheap relative to its profit stream, it will be ripe for a takeover. Most likely this will come from an even bigger, non-European oil company or by a wealth fund. It is highly likely in either case that the new purchaser will be less concerned about minimising the company’s environmental impact than those divesting. And any such commitments could easily be dropped in favour of a more concentrated focus on profits.

More worryingly, divestment is highly likely to constitute a small step in a chain of events that will perversely lead to precisely the opposite of the lobbyist’s desired outcome. When the University of Oxford (for example) sells its shares, they won’t simply disappear – rather they will be sold on the market to another investor. And the investors that are actively buying oil shares right now are unlikely to be those who are concerned about the environment.

Shareholder rights

The divestor also gives up the opportunity for shareholder activism – something USS does with the fossil fuel companies in which it holds investments. This is where shareholders can put pressure on companies they part own to introduce more sustainable ways of doing business. Although there is still much to be done, there is growing evidence that this kind of activism is having a positive effect on fossil fuel companies.

Many European oil companies are much better than their peers when it comes to environmental performance. While oil extraction and refinement is by its nature a dirty business, Shell, for instance, has a strong commitment to climate change mitigation. It aims to cut its net carbon footprint by 30% by 2035, and by 65% by 2050, meanwhile increasing the role of renewables in its energy production. Contrast this with some oil majors in the US whose only commitment is to the development of more effective extraction processes and more efficient fuel.

A counter-intuitive strategy for divestment activists would be for them to actually encourage the maintenance of large equity holdings in fossil fuel companies by sympathetic institutional investors, such as universities and USS. Then, by working together with other large shareholders and shareholder activist groups, bring real ownership pressure to bear in order to reduce the polluting activities of these companies. This would work by hitting them where it hurts – for instance, by blocking the awards of executive pay rises and bonuses.

Divestment puts shares in big oil into the hands of those who don’t give two hoots about the climate emergency, discourages such companies from taking mitigating steps and does nothing whatsoever to curb fossil fuel usage. If the question is how to tackle climate change, divestment is not even part of the answer.


About the Authors:

Adrian R. Bell, Chair in the History of Finance and Research Dean, Prosperity and Resilience, Henley Business School, University of Reading and Chris Brooks, Professor of Finance, Henley Business School, University of Reading

This article is republished from The Conversation under a Creative Commons license. Read the original article.


Ichimoku Cloud Analysis 30.06.2020 (GBPUSD, USDRUB, USDJPY)

Article By RoboForex.com

GBPUSD, “Great Britain Pound vs US Dollar”

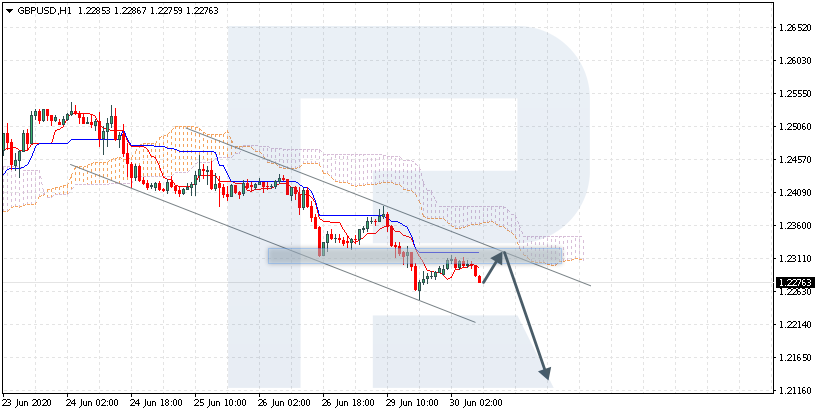
GBPUSD is trading at 1.2276; the instrument is moving below Ichimoku Cloud, thus indicating a descending tendency. The markets could indicate that the price may test Tenkan-Sen and Kijun-Sen at 1.2310 and then resume moving downwards to reach 1.2120. Another signal in favor of further downtrend will be a rebound from the rising channel’s downside border. However, the bearish scenario may no longer be valid if the price breaks the cloud’s upside border and fixes above 1.2415. In this case, the pair may continue growing towards 1.2505.

GBPUSD
Risk Warning: the result of previous trading operations do not guarantee the same results in the future

USDRUB, “US Dollar vs Russian Ruble”

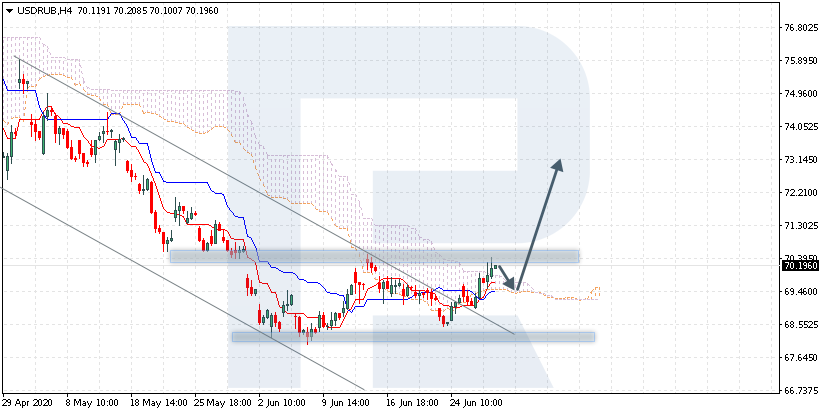
USDRUB is trading at 70.19; the instrument is moving above Ichimoku Cloud, thus indicating an ascending tendency. The markets could indicate that the price may test the cloud’s upside border at 69.50 and then resume moving upwards to reach 71.15. Another signal in favor of further uptrend will be a formation of a Double Bottom reversal pattern. However, the bullish scenario may be canceled if the price breaks the cloud’s downside border and fixes below 68.50. In this case, the pair may continue falling towards 67.05. To confirm further growth, the asset must break the resistance area and fix above 70.55, thus finishing the reversal pattern.

USDRUB
Risk Warning: the result of previous trading operations do not guarantee the same results in the future

USDJPY, “US Dollar vs Japanese Yen”

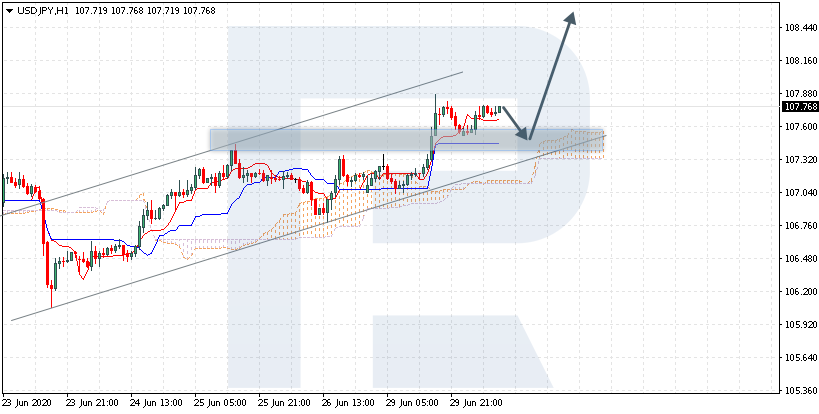
USDJPY is trading at 107.76; the instrument is moving above Ichimoku Cloud, thus indicating an ascending tendency. The markets could indicate that the price may test Tenkan-Sen and Kijun-Sen at 107.55 and then resume moving upwards to reach 108.45. Another signal is favor of further uptrend will be a rebound from the rising channel’s downside border. However, the bullish scenario may no longer be valid if the price breaks the cloud’s downside border and fixes below 106.95. In this case, the pair may continue falling towards 106.05.

USDJPY

Article By RoboForex.com

Attention!
Forecasts presented in this section only reflect the author’s private opinion and should not be considered as guidance for trading. RoboForex LP bears no responsibility for trading results based on trading recommendations described in these analytical reviews.

Japanese Candlesticks Analysis 30.06.2020 (USDCAD, AUDUSD, USDCHF)

Article By RoboForex.com

USDCAD, “US Dollar vs Canadian Dollar”

As we can see in the H4 chart, USDCAD is still testing the resistance level. By now, the price has formed several reversal patterns, including Long-Legged Doji. However, considering the current downtrend, one may assume that the asset may reverse and resume falling. In this case, the downside target is at 1.3510. Still, an opposite scenario suggests that the instrument may continue growing to reach 1.3773.

USDCAD
Risk Warning: the result of previous trading operations do not guarantee the same results in the future

AUDUSD, “Australian Dollar vs US Dollar”

As we can see in the H4 chart, AUDUSD is still correcting within the uptrend. By now, it has formed several; reversal patterns, including Hammer, not far from channel’s downside border. The target of the reversal pattern is the closest resistance level. Later, the price may resume a rising tendency. In this case, the mid-term upside target remains at 0.7070. At the same time, one shouldn’t exclude another scenario, which implies that the instrument may continue falling towards 0.6790.

AUDUSD
Risk Warning: the result of previous trading operations do not guarantee the same results in the future

USDCHF, “US Dollar vs Swiss Franc”

As we can see in the H4 chart, after forming a Hammer pattern and reversing, USDCHF has rebounded from the support level. At the moment, the pair continues forming the rising impulse. In this case, the upside target is at 0.9578. Later, the market may rebound from the resistance level and resume trading downwards. In this case, the downside target may be the support level at 0.9380.

USDCHF

Article By RoboForex.com

Attention!
Forecasts presented in this section only reflect the author’s private opinion and should not be considered as guidance for trading. RoboForex LP bears no responsibility for trading results based on trading recommendations described in these analytical reviews.

The Analytical Overview of the Main Currency Pairs on 2020.06.30

by JustForex

The EUR/USD currency pair

Technical indicators of the currency pair:
  • Prev Open: 1.12166
  • Open: 1.12361
  • % chg. over the last day: +0.17
  • Day’s range: 1.12041 – 1.12518
  • 52 wk range: 1.0777 – 1.1494

There is an ambiguous technical pattern on the EUR/USD currency pair. The trading instrument is in a sideways trend. At the moment, the local support and resistance levels are 1.1210 and 1.1250, respectively. The demand for risky assets has been resumed amid signs of global economic recovery. Financial market participants expect a speech by the Fed Chairman. Positions should be opened from key levels.

The Economic News Feed for 2020.06.30:
  • – Consumer price index in the Eurozone at 12:00 (GMT+3:00);
  • – CB consumer confidence index in the US at 17:00 (GMT+3:00).

At 19:30 (GMT+3:00), the Fed Chairman will give a speech.

EUR/USD

Indicators do not give accurate signals: 50 MA has crossed 100 MA.

The MACD histogram has started declining, which indicates the development of bearish sentiment.

Stochastic Oscillator is in the neutral zone, the %K line is above the %D line, which gives a signal to buy EUR/USD.

Trading recommendations
  • Support levels: 1.1210, 1.1175, 1.1140
  • Resistance levels: 1.1250, 1.1285, 1.1310

If the price fixes below the level of 1.1210, EUR/USD quotes are expected to fall. The movement is tending to 1.1175-1.1140.

An alternative could be the growth of the EUR/USD currency pair to 1.1280-1.1300.

The GBP/USD currency pair

Technical indicators of the currency pair:
  • Prev Open: 1.23313
  • Open: 1.22995
  • % chg. over the last day: -0.34
  • Day’s range: 1.22595 – 1.23170
  • 52 wk range: 1.1466 – 1.3516

The GBP/USD currency pair shows a negative trend. The British pound has set new local lows. Currently, GBP/USD quotes are consolidating in the range of 1.2260-1.2315. The British pound is still under pressure amid weak UK GDP report. A trading instrument has the potential for further decline. Today we recommend paying attention to the news feed on the US economy. Positions should be opened from key levels.

GBP/USD

Indicators signal the power of sellers: the price has fixed below 50 MA and 100 MA.

The MACD histogram is in the negative zone, which gives a signal to sell GBP/USD.

Stochastic Oscillator is in the neutral zone, the %K line is above the %D line, which indicates the development of bullish sentiment.

Trading recommendations
  • Support levels: 1.2260, 1.2200
  • Resistance levels: 1.2315, 1.2385, 1.2435

If the price fixes below 1.2260, a further fall in GBP/USD quotes is expected. The movement is tending to the round level of 1.2200.

An alternative could be the growth of the GBP/USD currency pair to 1.2360-1.2400.

The USD/CAD currency pair

Technical indicators of the currency pair:
  • Prev Open: 1.36766
  • Open: 1.36588
  • % chg. over the last day: -0.16
  • Day’s range: 1.36528 – 1.36949
  • 52 wk range: 1.2949 – 1.4668

The loonie has become stable. USD/CAD quotes are in a sideways trend. There is no defined trend. The key support and resistance levels are 1.3650 and 1.3715, respectively. Financial market participants expect additional drivers. We recommend paying attention to the dynamics of “black gold” prices. Positions should be opened from key levels.

At 15:30 (GMT+3:00), Canada’s GDP data will be published.

USD/CAD

Indicators indicate the power of buyers: the price has fixed above 50 MA and 100 MA.

The MACD histogram has started rising, which indicates the development of bullish sentiment.

Stochastic Oscillator is in the neutral zone, the %K line has crossed the %D line. There are no signals at the moment.

Trading recommendations
  • Support levels: 1.3650, 1.3615, 1.3560
  • Resistance levels: 1.3715, 1.3750

If the price fixes above 1.3715, further growth of USD/CAD quotes is expected. The movement is tending to 1.3750-1.3770.

An alternative could be a decrease in the USD/CAD currency pair to 1.3620-1.3580.

The USD/JPY currency pair

Technical indicators of the currency pair:
  • Prev Open: 107.072
  • Open: 107.563
  • % chg. over the last day: +0.17
  • Day’s range: 107.527 – 107.787
  • 52 wk range: 101.19 – 112.41

Purchases prevail on the USD/JPY currency pair. The trading instrument has overcome and fixed above the key extremes. At the moment, the “safe haven” currency is consolidating. The local support and resistance levels are 107.55 and 107.85, respectively. USD/JPY quotes have the potential for further growth. We recommend paying attention to the dynamics of US government bonds yield. Positions should be opened from key levels.

The news feed on Japan’s economy is quite calm.

USD/JPY

Indicators signal the power of buyers: the price has fixed above 50 MA and 100 MA.

The MACD histogram is in the positive zone, indicating the bullish sentiment.

Stochastic Oscillator is in the neutral zone, the %K line has crossed the %D line. There are no signals at the moment.

Trading recommendations
  • Support levels: 107.55, 107.35, 107.05
  • Resistance levels: 107.85, 108.20

If the price fixes above 107.85, further growth of USD/JPY quotes is expected. The movement is tending to 108.20-108.40.

An alternative could be a decrease in the USD/JPY currency pair to 107.35-107.10.

by JustForex

Russell 2000 Gaps Present Real Targets

By TheTechnicalTraders 

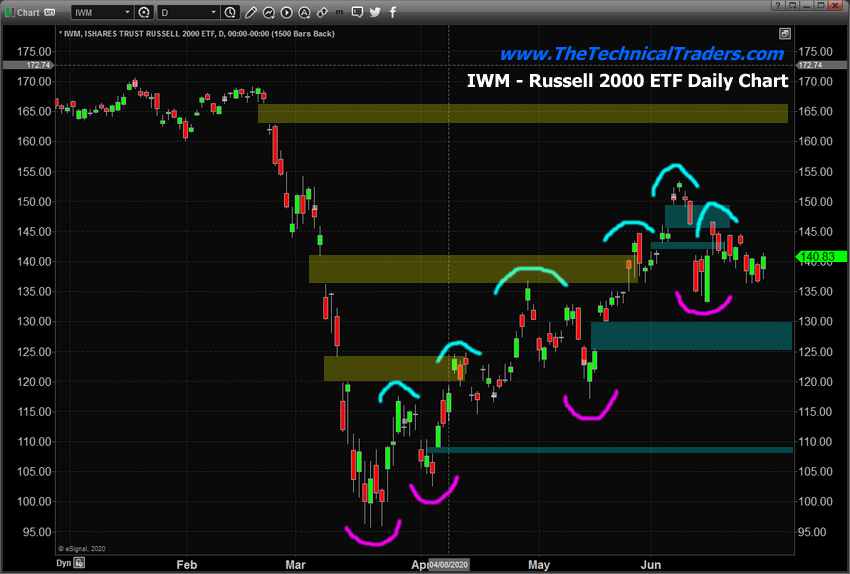
– Recent Gaps in price action in the IWM (Russell 2000 ETF) presents a clear picture of future price targets and support/resistances.  Gaps are one of the most common forms of Technical Analysis techniques.  They represent “voids” where price activity has skipped a range of price as it advances or declines aggressively.

Gaps are commonly used as targets for future price activity – where price attempts to “fill the gap”. In Technical Analysis theory, any gap that appears should eventually be “filled” by price in the future.  Thus, any open gap that does not fill is still considered an “open target range”.

IWM PROVIDES A UNIQUE PERSPECTIVE

We’re focusing on the Russell 2000 because we believe it provides a unique perspective on the markets related to the recent COVID-19 downside price swing and the recent recovery.  The Mid-Cap market sector tends to trend more quickly than the US major indexes and can sometimes provide a clear picture of more true price trends.

In this case, we’ve highlighted the downside price Gaps in YELLOW and the upside price Gaps in BLUE.  Two of the downside price Gaps have been filled recently as price advanced higher after March 21, 2020.  Additionally, the two highest downside price Gaps have also been filled – leaving the lower two still open (unfilled).

This presents a very easy to understand the method of identifying future price targets for both bullish and bearish price trends.  Either price will rally to fill the upper Gap, near $163~166, or price will breakdown into a bearish trend attempting to fill the $125~130 Gap or the $108~109 Gap.

The recent low price level near $133.28 broke previous Fibonacci low price levels from May 29. Because of this, we believe the current trend is moderately Bearish.  We would like to see a new lower low setup to confirm this new trend.  When we consider the next price move in the Russell 2000 ETF, two very clear targets become evident, either the recent upper BLUE Gap range between $145~149 or the lower BLUE Gap range between $125~129.

IWM Weekly Chart

The IWM Weekly chart does not illustrate the shorter term Gap patterns as price volatility has consolidated into longer-term price bars.  Still, we have to very clear Gaps on the Weekly IWM chart- the upper Gap, near $163~166, and the lower Gap, near $136~141.  This lower price Gap is currently acting as a support/resistance channel for the price as the IWM price consolidates within this range.  A breakout/breakdown move is very likely as the future price trend will likely exit this Gap range with an aggressive price move.

The lower Gaps that are evident on the Daily chart are still valid price levels on this chart – we’re just not seeing them on this Weekly chart because of the compressed interval.

Before you continue, be sure to opt-in to our free market trend signals before closing this page, so you don’t miss our next special report!

As we near the end of June 2020 (Q2), it is fitting that the IWM price level has stalled near this 50% Fibonacci retracement level and within the middle Gap level.  This level will likely continue to attract price as it consolidates before entering the breakout or breakdown trend.  Again, based on the Fibonacci price theory, the recent low suggests the current trend is Bearish.

The 4th of July holiday weekend is nearing and prices tend to consolidate, absent any major news or earnings data, before any major holiday.  Therefore, we may see price levels stay rather narrow this week as we await Q2 earnings and prior to the 4th of July holiday.  Stay properly protected in this market.  Any breakdown/breakout move will likely happen very quickly in the near future.

In short, I hope you glean something useful from this article. If this is the start of a double-dip, it’s going to be huge, and if it’s the start of a bear market, it is going to be life-changing.

If you are new to trading, technical analysis, or are a long term passive investor worried about what to do, you can follow my lead. I share both my investing signals and more active swing trade signals using simple ETFs at TheTechnicalTraders.com.

Chris Vermeulen
Chief Market Strategist
TheTechnicalTraders.com