Author Archive for InvestMacro – Page 16

Rethinking the boundaries between economic life and coronavirus death

By Carolyn Prouse, Queen’s University, Ontario; Beverley Mullings, Queen’s University, Ontario; Dairon Luis Morejon Perez, Queen’s University, Ontario, and Shannon Clarke, Queen’s University, Ontario

As governments around the world begin to reopen their borders, it’s clear that efforts to revive the economy are redrawing the lines between who will prosper, who will suffer and who will die.

Emerging strategies for restoring economic growth are forcing vulnerable populations to choose between increased exposure to death or economic survival. This is an unacceptable choice that appears natural only because it prioritizes the economy over people already considered marginal or expendable.

The management of borders has always been central to capitalist economic growth, and has only intensified with neoliberal reforms of the last several decades. Neoliberal economic growth has increasingly become tied to opening up national borders to the flow of money and the selective entry of low-wage labour with limited access to rights.

Nation-state borders regulate this flow, and in so doing, reconstitute the borders between people: those whose lives must be safeguarded and those who are considered disposable.

COVID-19 has brought heightened visibility to these border-making practices, with the pandemic intensifying the decisions between economic and social life.

covid world

Image by Miroslava Chrienova from Pixabay

Exceptions made for seasonal workers

Early in the outbreak, for instance, Canada closed its borders to international travel, but made exceptions for an estimated 60,000 seasonal agricultural workers from Latin America and the Caribbean.

Anxious to avert the potential loss of as much as 95 per cent of this year’s vegetable and fruit production, temporary farm workers were deemed the essential backbone of the agri-food economy. For the health and safety of Canadians and seasonal farm workers, farmers required the farm workers to self-isolate for 14 days in order to prevent the spread of the virus.

But the deaths of two farm workers in Windsor, Ont., and serious outbreaks of COVID-19 infections among migrant workers on farms across the country, have revealed systemic forms of racism that reveal the priority given to profit maximization over the health and safety of Black and brown migrant farmers.

Under the Temporary Foreign Worker Program, migrant farmers are not entitled to standard labour rights such as a minimum wage, overtime pay or days off, and federal oversight over housing conditions has been notoriously inadequate.

With worker welfare left largely to the discretion of employers, it is not altogether surprising that reports of crowded and unsanitary housing, an inability to socially distance, delays in responding to COVID-19 symptoms and threats of reprisals for speaking out have become rife throughout the agri-food economy. Even as COVID-19 cases soar in Ontario, provincial guidelines make it possible for infected farm workers to continue working if they are asymptomatic.

It is a tragic irony that the quest for a better life among migrant workers should be one that demands levels of exposure to abuse, threats, infection and premature death that few citizens are likely to face.

Choosing between health and the economy

Now, as governments speak of opening borders more widely due to the economic costs of COVID-19, countries are beginning to make new, challenging decisions between public health and economic growth.

For example, across the Caribbean, the abrupt closure of international borders decimated the region’s tourism industry overnight. Estimating a contraction of the industry of up to 70 per cent, Standard & Poor has already predicted that some islands will experience significantly deteriorated credit ratings.

For example, with tourism accounting for half of Jamaica’s foreign exchange earnings and more than 350,000 jobs, it is not entirely surprising that the tourism minister has justified re-opening as “not just about tourism. It is a matter of economic life or death.” It’s also not surprising that resort chains like Sandals and airlines alike have been eager to resume business as usual.

But assurances that “vacations are back,” even as new cases emerge, ring hollow given that most Caribbean countries have long struggled with overburdened health-care systems. And even with new protocols for screening, isolating or restricting the mobility of infected visitors, it is likely that the region’s poorer citizens — many of whom are women in front-line hospitality services — will bear the brunt of the costs of new infections.

Unequal dependencies

The dependence of Caribbean and Latin American governments on tourism and remittance dollars, and Canada’s dependence on Black and brown people to carry out low-paid essential work, are unequal dependencies that are intimately tied. For the most vulnerable, these dependencies mark the stark overlap between economic life and COVID-19 death.

Yet COVID-19 has also presented us with a unique opportunity to rethink the border inequalities that have governed our lives and the primacy of the economy within it.

It forces us to ask: Who does “the economy” serve? What types of activities are valued or dismissed when we prioritize economic growth? Whose life is valued, and whose continues to be expendable?

Prioritizing the economy over the lives of the poorest and most vulnerable should never be an acceptable fix.

About the Authors:

This is a collaborative article written by members of the Global Economies and Everyday Lives Lab at Queen’s University, Canada. Nathalia Ocasio Santos, Grace Adeniyi Ogunyankin, Priscilla Apronti, Hilal Kara and Tesfa Peterson co-authored this piece.The Conversation

Carolyn Prouse, Assistant Professor of Human Geography, Queen’s University, Ontario; Beverley Mullings, Professor of Geography, Queen’s University, Ontario; Dairon Luis Morejon Perez, Phd Student in Geography and Urban Planning, Queen’s University, Ontario, and Shannon Clarke, PhD Student in Geography, Queen’s University, Ontario

This article is republished from The Conversation under a Creative Commons license. Read the original article.


Fibonacci Retracements Analysis 06.07.2020 (GOLD, USDCHF)

Article By RoboForex.com

XAUUSD, “Gold vs US Dollar”

From the technical point of view, the H4 chart shows that XAUUSD is moving above the broken high at 1764.86. This situation means that the pair has fixed above the high at 1789.05 in order to continue the ascending tendency towards the post-correctional extension area between 138.2% and 161.8% fibo at 1800.60 and 1822.70 respectively. However, a divergence on MACD and low market volatility indicate a possible reversal or pullback. The key support is at 1670.60. The first correctional target may be 23.6% fibo at 1709.30, while the next ones are 38.2%, 50.0%, and 61.8% fibo at 1660.00, 1620.30, and 1580.30 respectively.

GOLD_H4
Risk Warning: the result of previous trading operations do not guarantee the same results in the future

As we can see in the H1 chart, there was a local divergence on MACD, which made the pair start a new decline that has already tested 23.6% fibo. Later, the decline may continue to reach 38.2%, 50.0%, and 61.8% fibo at 1743.85, 1730.00, and 1715.90 respectively.

GOLD_H1
Risk Warning: the result of previous trading operations do not guarantee the same results in the future

USDCHF, “US Dollar vs Swiss Franc”

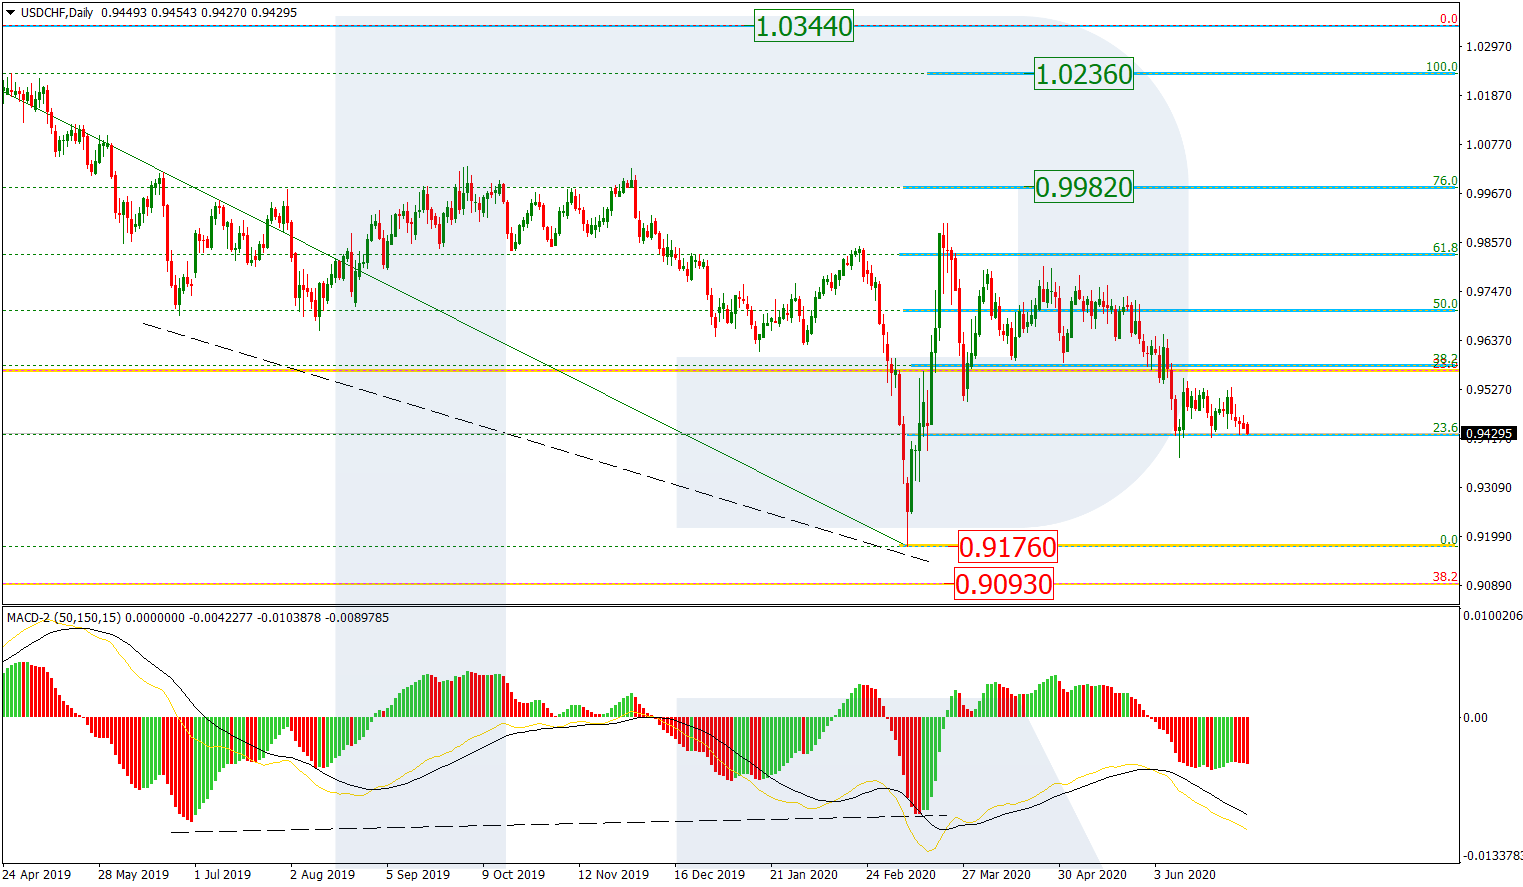
As we can see in the daily chart, after quickly reaching 61.8% fibo, USDCHF has returned to 61.8% fibo. Although the current dynamics is descending, the previous divergence may not be over yet, which means that the pair still has a chance to form a new rising impulse towards the mid-term 76.0% at 0.9982 and then the fractal high at 1.0236.

USDCHF_D1
Risk Warning: the result of previous trading operations do not guarantee the same results in the future

The situation in the H4 chart hasn’t changed much over a week. The chart is still showing attempts of the price to break a short-term correctional Triangle pattern to the downside, which means that the market wants to continue the bearish tendency towards the mid-term 76.0% fibo at 0.9350 after breaking the low at 0.9376. However, as usual, one shouldn’t exclude another scenario, according to which the instrument may form a new rising impulse after finishing the correction and testing the low. In this case, the asset may move towards 38.2%, 50.0%, and 61.8% fibo at 0.9577, 0.9639, and 0.9700 respectively.

USDCHF_H4

Article By RoboForex.com

Attention!
Forecasts presented in this section only reflect the author’s private opinion and should not be considered as guidance for trading. RoboForex LP bears no responsibility for trading results based on trading recommendations described in these analytical reviews.

Forex Technical Analysis & Forecast 06.07.2020

Article By RoboForex.com

EURUSD, “Euro vs US Dollar”

EURUSD is moving upwards. Possibly, the pair may reach 1.1290 and then start a new correction towards 1.1262. After that, the instrument may form one more ascending structure with the target at 1.1305 and then start another correction to return to 1.1262.

EURUSD
Risk Warning: the result of previous trading operations do not guarantee the same results in the future

GBPUSD, “Great Britain Pound vs US Dollar”

GBPUSD is trading upwards to break 1.2485 and may later continue growing towards 1.2512. Later, the market may correct to return to 1.2485 and then start another growth to reach 1.2533. After that, the instrument may resume falling inside the downtrend with the target at 1.2424.

GBPUSD
Risk Warning: the result of previous trading operations do not guarantee the same results in the future

USDRUB, “US Dollar vs Russian Ruble”

After completing another ascending structure towards 71.66, which may be considered as the third wave to the upside, USDRUB is expected to correct to reach 70.00, at least. After that, the instrument may resume growing with the target at 72.12.

USDRUB
Risk Warning: the result of previous trading operations do not guarantee the same results in the future

USDJPY, “US Dollar vs Japanese Yen”

USDJPY is consolidating around 107.57. Today, the pair may grow to reach 107.81 and then start a new decline to return to 107.57. If later the price breaks this range to the upside the market may form one more ascending structure with the target at 108.01 or even 108.22.

USDJPY
Risk Warning: the result of previous trading operations do not guarantee the same results in the future

USDCHF, “US Dollar vs Swiss Franc”

USDCHF is moving close to the downside border of the range. Possibly, today the pair may form another ascending wave towards 0.9450. After that, the instrument may fall to break 0.9430 and then continue trading downwards with the target at 0.9387.

USDCHF
Risk Warning: the result of previous trading operations do not guarantee the same results in the future

AUDUSD, “Australian Dollar vs US Dollar”

AUDUSD is moving upwards; it has already broken 0.6945 to the upside. Possibly, the pair may test this level from above and then form another ascending structure with the target at 0.6988 or even 0.7000.

AUDUSD
Risk Warning: the result of previous trading operations do not guarantee the same results in the future

BRENT

Brent is trading upwards and may reach 43.80. Later, the market may correct to reach 42.44 and then start another growth towards 45.20 to complete this ascending wave. After that, the instrument may start another correction with the first target at 41.50.

BRENT
Risk Warning: the result of previous trading operations do not guarantee the same results in the future

XAUUSD, “Gold vs US Dollar”

Gold is still consolidating around 1777.00. Today, the pair may test 1768.15 from above and then resume trading upwards with the short-term target at 1786.00 or even 1798.00.

GOLD
Risk Warning: the result of previous trading operations do not guarantee the same results in the future

BTCUSD, “Bitcoin vs US Dollar”

After finishing the descending impulse at 8900.00, BTCUSD is still consolidating and growing towards 9100.00. If later the price breaks this range to the upside, the market may form one more ascending structure with the target at 9550.00; if to the downside at 0.9490 – resume trading inside the downtrend to reach 8700.00.

BITCOIN
Risk Warning: the result of previous trading operations do not guarantee the same results in the future

S&P 500

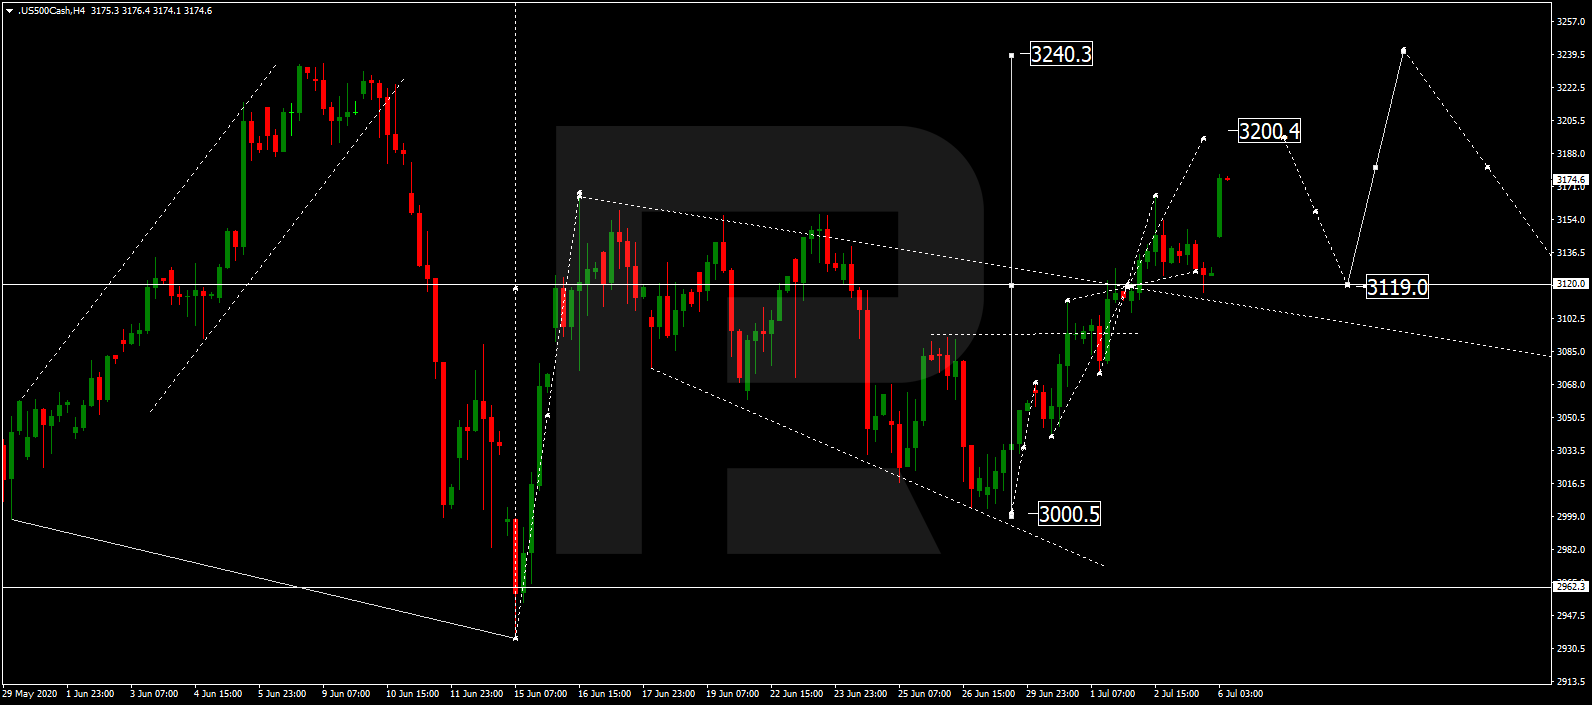
The Index is moving upwards. Possibly, the asset may reach 3200.4 and then correct towards 3119.0. After that, the instrument may resume trading upwards with the short-term target at 3240.3.

S&P 500

Article By RoboForex.com

Attention!
Forecasts presented in this section only reflect the author’s private opinion and should not be considered as guidance for trading. RoboForex LP bears no responsibility for trading results based on trading recommendations described in these analytical reviews.

Currency Majors Are Consolidating. Investors Expect US Economic Releases

by JustForex

Greenback shows multidirectional dynamics relative to a basket of world currencies. The dollar index (#DX) is consolidating in the range of 96.85-97.30. Financial market participants are increasingly concerned about new outbreaks of coronavirus cases. The number of infected around the world has reached 11.5 million.

The head of the European Council, Charles Michel, said that it would take several years for the EU to return to the pre-crisis level after the COVID-19 epidemic. Today, investors will be focused on the ISM Non-Manufacturing Purchasing Managers Index for the US from June. It is expected that the indicator will accelerate from 45.4 to 50.1.

Purchases prevail in the black gold market. Currently, the WTI crude oil futures are testing the $40.85 per barrel mark.

Market indicators

On Friday, US stock markets were closed due to the holiday.

The 10-year US government bonds yield has shifted to growth. At the moment, the indicator is at the level of 0.68-0.69%.

The news feed on 2020.07.06:
  • – The index of business activity in the UK construction sector at 11:30 (GMT+3:00);
  • – ISM Non-Manufacturing PMI of the USA at 17:00 (GMT+3:00).

by JustForex

The Analytical Overview of the Main Currency Pairs on 2020.07.06

by JustForex

The EUR/USD currency pair

Technical indicators of the currency pair:
  • Prev Open: 1.12347
  • Open: 1.12432
  • % chg. over the last day: +0.08
  • Day’s range: 1.12386 – 1.13027
  • 52 wk range: 1.0777 – 1.1494

The EUR/USD quotes have been growing. The trading instrument has reached local highs. At the moment, the euro is testing the round level of 1.1300. The 1.1270 mark is immediate support. The technical pattern signals the further growth of the trading instrument. Investors are worried about new outbreaks of coronavirus in the United States. Today, the focus is on economic releases from the United States. We recommend opening positions from key support and resistance levels.

News feed for 2020.07.06:
  • At 17:00 (GMT+3:00), the ISM US Purchasing Managers Index will be published.
EUR/USD

Indicators signal the power of buyers: the price has fixed above 50 MA and 100 MA.

The MACD histogram is in the positive zone, indicating bullish sentiment.

Stochastic Oscillator has started to go out of the overbought zone, the %K line is below the %D line, which gives a signal to sell EUR/USD.

Trading recommendations
  • Support levels: 1.1270, 1.1245, 1.1220
  • Resistance levels: 1.1300, 1.1325

If the price fixes above 1.1300, further growth of EUR/USD quotes is expected. The movement is tending to 1.1325-1.1350.

An alternative could be a decrease in the EUR/USD currency pair to 1.1245-1.1220.

The GBP/USD currency pair

Technical indicators of the currency pair:
  • Prev Open: 1.24640
  • Open: 1.24618
  • % chg. over the last day: -0.02
  • Day’s range: 1.24547 – 1.25097
  • 52 wk range: 1.1466 – 1.3516

The GBP/USD currency pair is in a flat. Unidirectional trends are not observed. Participants in financial markets expect additional drivers. At the moment, the local support and resistance levels are 1.2460 and 1.2510, respectively. The pound sterling is tending to recover. We are expecting statistics from the USA. Positions must be opened from key levels.

In June, the index of business activity in the UK construction sector was 55.3, which is significantly higher than market expectations of 47.0.

GBP/USD

Indicators do not send accurate signals: the price is consolidating near 50 MA.

The MACD histogram is in the positive zone, indicating bullish sentiment.

Stochastic Oscillator is in the neutral zone, the %K line is below the %D line, which gives a signal to sell GBP/USD.

Trading recommendations
  • Support levels: 1.2460, 1.2435, 1.2400
  • Resistance levels: 1.2510, 1.2540

If the price fixes above 1.2510, GBP/USD is expected to rise. The movement is tending to 1.2540-1.2570.

An alternative could be a decrease of the GBP/USD currency pair to 1.2430-1.2400.

The USD/CAD currency pair

Technical indicators of the currency pair:
  • Prev Open: 1.35671
  • Open: 1.35601
  • % chg. over the last day: -0.13
  • Day’s range: 1.35196 – 1.35626
  • 52 wk range: 1.2949 – 1.4668

The USD/CAD has moved down. The trading instrument has updated local lows. Loonie is currently consolidating in the range of 1.3520-1.3555. Positive dynamics in the black gold market supports the Canadian dollar. The USD/CAD currency pair is tending to further decline. We recommend paying attention to the news feed on the US economy. Positions must be opened from key levels.

The publication of important economic reports from Canada is not planned.

USD/CAD

Indicators point to the power of sellers: the price has fixed below 50 MA and 100 MA.

The MACD histogram is in the negative zone, indicating bearish sentiment.

Stochastic Oscillator is in the neutral zone, the %K line is above the %D line, which gives a signal to buy USD/CAD.

Trading recommendations
  • Support levels: 1.3520, 1.3490
  • Resistance levels: 1.3555, 1.3580, 1.3610

If the price fixes below 1.3520, a further drop in the USD/CAD quotes is expected. The movement is tending to 1.3490-1.3470.

An alternative could be the growth of the USD/CAD currency pair to 1.3580-1.3610.

The USD/JPY currency pair

Technical indicators of the currency pair:
  • Prev Open: 107.482
  • Open: 107.460
  • % chg. over the last day: -0.01
  • Day’s range: 107.439 – 107.773
  • 52 wk range: 101.19 – 112.41

The USD/JPY currency pair is still in a prolonged flat. Unidirectional trends are not observed. Investors expect additional drivers. The key support and resistance levels are 107.35 and 107.75, respectively. Today, the focus is on statistics on the US economy. We also recommend paying attention to the dynamics of yield on US government bonds. Positions must be opened from key levels.

The publication of important economic reports from Japan is not planned.

USD/JPY

Indicators do not send accurate signals: the price has crossed 50 MA.

The MACD histogram is near the 0 mark.

Stochastic Oscillator is located near the oversold zone, the %K line has crossed the %D line. There are no signals at the moment.

Trading recommendations
  • Support levels: 107.35, 107.05, 106.80
  • Resistance levels: 107.75, 108.10

If the price fixes below 107.35, USD/JPY is expected to fall. The movement is tending to 107.00-106.70.

An alternative could be the growth of the USD/JPY currency pair to 108.00-108.30.

by JustForex

Gold Got Inside Flat

By Dmitriy Gurkovskiy, Chief Analyst at RoboForex

Gold is looking quite stable during the second week of July – the asset is trading at $1785.40 USD after updating its last week’s highs at $1807.70.

Here and now, market players are finally paying enough attention to the macroeconomic: expectations from China are quite positive as the country’s economy is anticipated to recover faster and stronger than other countries. This, in its turn, slows down investors’ interest in “safe haven” assets, including Gold.

However, it’s clearly seen that strategically investors are in no hurry to ditch their long-term positions in Gold, and it’s understandably why. The COVID-19 hasn’t been defeated yet, and that’s a risk. Global economies are still experiencing the crisis, and that’s a risk too. The American Dollar may remain under pressure for a long time, and that’s good for Gold.

All this taken together creates strategic support for the price of Gold, that’s why there are no rapid decisions to sell the instrument.

As we can see in the H4 chart, XAU/USD is trading to break 1778.86 to the upside and may later continue growing towards 1800.00. Later, the market may start a new correction to return to 1778.00 and then form one more ascending structure with the target at 1818.20. From the technical point of view, this scenario is confirmed by MACD Oscillator: its signal line is moving above 0, thus indicating further uptrend on the price chart.

In the H1 chart, XAU/USD is growing towards 1778.80. After reaching this level, the pair may form a new consolidation range and then break it to the upside. In this case, the pair may continue growing with the short-term target of another ascending wave at 1786.50. From the technical point of view, this scenario is confirmed by Stochastic Oscillator: its signal line is moving directly upwards, thus confirming further uptrend until the line breaks 80. After that, there might be a correction on the price chart, while the line is expected to fall towards 50.

Disclaimer

Any predictions contained herein are based on the author’s particular opinion. This analysis shall not be treated as trading advice. RoboForex shall not be held liable for the results of the trades arising from relying upon trading recommendations and reviews contained herein.

DAX30 bulls in control of the action again – 13,000 here we come?

By Admiral Markets

Economic events calendar

Source: Economic Events July 6, 2020 – Admiral Markets’ Forex Calendar

After the DAX30 consolidated between 11,950 and 12,370/400 points over the last week of trading and bears failed right on Monday with their attempt to push the German index out of the range on the downside, bulls captured control.

Last Thursday, bulls succeeded in their attempt to break higher, driven and supported by the news that Pfizer and Biontech announced positive results in regards to the search for a Covid-19 vaccine (announced on Wednesday) and solid US labour market data.

Non-Farm Payrolls came in at 4.8 million for June against 3.23 million expected, May data being revised higher from 2.509 million to 2.699 million and the unemployment rate dropping to 11.1% from previously 13.3%.

While the BLS admitted another “survey error” after March, April and May which resulted in an artificially lower unemployment rate, markets seem to completely ignore the obviously manipulated and politically driven environment.

Technically, for the start of the week, further gains in the DAX30 are to be favoured, a first target on the upside can be found around 12,750 points, above and in the days to come a next target can be found around 12,900 points.

A solid support and potential long trigger can be found around 12,370/400 points, last week’s breakout region:

DAX30 CFD hourly chart

Source: Admiral Markets MT5 with MT5-SE Add-on DAX30 CFD Hourly chart (between June 16, 2020, to July 3, 2020). Accessed: July 3, 2020, at 10:00pm GMT

DAX30 CFD daily chart

Source: Admiral Markets MT5 with MT5-SE Add-on DAX30 CFD Daily chart (between March 20, 2019, to July 3, 2020). Accessed: July 3, 2020, at 10:00pm GMT – Please note: Past performance is not a reliable indicator of future results, or future performance.

In 2015, the value of the DAX30 CFD increased by 9.56%, in 2016, it increased by 6.87%, in 2017, it increased by 12.51%, in 2018, it fell by 18.26%, in 2019, it increased by 26.44% meaning that after five years, it was up by 34.2%.

Check out Admiral Markets’ most competitive conditions on the DAX30 CFD and start trading on the DAX30 CFD with a low 0.8 point spread offering during the main Xetra trading hours!

Discover the world’s #1 multi-asset platform

Admiral Markets offers professional traders the ability to trade with a custom, upgraded version of MetaTrader 5, allowing you to experience trading at a significantly higher, more rewarding level. Experience benefits such as the addition of the Market Heat Map, so you can compare various currency pairs to see which ones might be lucrative investments, access real-time trading data, and so much more. Click the banner below to start your FREE download of MT5 Supreme Edition!

Download MetaTrader 5 and begin trading today!

Disclaimer: The given data provides additional information regarding all analysis, estimates, prognosis, forecasts or other similar assessments or information (hereinafter “Analysis”) published on the website of Admiral Markets. Before making any investment decisions please pay close attention to the following:

  1. This is a marketing communication. The analysis is published for informative purposes only and are in no way to be construed as investment advice or recommendation. It has not been prepared in accordance with legal requirements designed to promote the independence of investment research, and that it is not subject to any prohibition on dealing ahead of the dissemination of investment research.
  2. Any investment decision is made by each client alone whereas Admiral Markets shall not be responsible for any loss or damage arising from any such decision, whether or not based on the Analysis.
  3. Each of the Analysis is prepared by an independent analyst (Jens Klatt, Professional Trader and Analyst, hereinafter “Author”) based on the Author’s personal estimations.
  4. To ensure that the interests of the clients would be protected and objectivity of the Analysis would not be damaged Admiral Markets has established relevant internal procedures for prevention and management of conflicts of interest.
  5. Whilst every reasonable effort is taken to ensure that all sources of the Analysis are reliable and that all information is presented, as much as possible, in an understandable, timely, precise and complete manner, Admiral Markets does not guarantee the accuracy or completeness of any information contained within the Analysis. The presented figures refer that refer to any past performance is not a reliable indicator of future results.
  6. The contents of the Analysis should not be construed as an express or implied promise, guarantee or implication by Admiral Markets that the client shall profit from the strategies therein or that losses in connection therewith may or shall be limited.
  7. Any kind of previous or modeled performance of financial instruments indicated within the Publication should not be construed as an express or implied promise, guarantee or implication by Admiral Markets for any future performance. The value of the financial instrument may both increase and decrease and the preservation of the asset value is not guaranteed.
  8. The projections included in the Analysis may be subject to additional fees, taxes or other charges, depending on the subject of the Publication. The price list applicable to the services provided by Admiral Markets is publicly available from the website of Admiral Markets.

Leveraged products (including contracts for difference) are speculative in nature and may result in losses or profit. Before you start trading, you should make sure that you understand all the risks.

By Admiral Markets

Prepare for the global impact of US COVID-19 resurgence

By Dan Steinbock

– Recently, the US has suffered a series of COVID-19 surges. The escalation won’t stay in America. It is likely to cause collateral damage worldwide.  

In early June, U.S. states began to exit from the lockdown measures, even though the epidemic curve had not been adequately flattened. On July 4th, the White House sought for a “return to normal” with a celebration at Mount Rushmore, where President Trump, who has recently associated himself with far-right “white power” extremists, gave a bizarre speech warning about a “new far-left fascism.”

And once again, the Trump crowds were not required to wear face masks or practice social distancing, although the US has recently tallied its highest single-day totals of coronavirus infections. Currently confirmed virus cases in the US total 3 million, with almost 135,000 deaths, while new confirmed cases average over 50,000 daily.

Despite the Independence Day, traditional July 4th routines – beer, beach and BBQs – were severely adjusted. Florida, still another state that rushed a premature exit, set a national record with more than 10,000 new cases.

Not so long ago, younger people were hosting COVID-19 parties “like there was no tomorrow.” Many may now get what they wished for. When the White House began to mobilize against the pandemic two months ago, more than two of three patients were aged 50 or older. But today, almost 60% of cases are aged 18-49.

The COVID-19 surge across America is no surprise, however. It was only to be expected in light of the catastrophic mishandling of the pandemic by the White House, as I projected in The Tragedy of Missed Opportunities in April (click here). The following draws from that report; only data has been updated.

White House alerted on Jan 3, yet mobilized 2 months later

On January 3, when the virus gene sequencing was completed by China’s CDC and emergency monitoring initiated, Chinese officials notified WHO and relevant countries. That day, U.S. CDC director Dr. Robert R. Redfield called Alex M. Azar II, secretary of health, telling him that China had potentially discovered a new coronavirus. In turn, Azar informed the National Security Council (NSC), for a reason.

When Trump arrived in the White House three years before, his administration killed the global health unit that had been part of the NSC and that had been created to respond to potential global pandemics. Now a newly-created team began daily meetings in the basement of the West Wing. Yet, no mobilization occurred in the US. Instead, a long debate began within the Trump administration over “what to tell to the American public.”

Between the first recorded case in Wuhan (Dec 30, 2019), and the WHO’s announcement of the international emergency (Jan 30, 2020), the epicenter of the outbreak was in China. Yet, first cases were also recorded in 20 countries worldwide, including the US. But once again, the Trump White House chose not to mobilize.

On March 10, the WHO declared the virus a pandemic. By then, the epicenter had moved from Europe to the US. It was only on March 13 that the White House began to mobilize federal resources against the COVID-19 outbreak. By then, there were 1,264 confirmed cases in the U.S. and 277 deaths. The figures grossly under-estimated the spread of the virus since basic testing capacity and diagnoses were lagging into April.

Trump’s crisis mishandling had deferred the inevitable awakening but when it finally ensued, it would prove devastating, as I projected in April. Subdued by the trade wars and after growth of 2.3% in the 4th quarter, the U.S. GDP growth suffered a -5% contraction in the 1st quarter and is likely to cope with a historical -53% plunge in the 2nd quarter.

Playing the blame game  

As the Trump administration began national mobilization weeks belatedly, it struggled to reduce the economic damage by reopening the economy after mid-April. Trump gave governors a road map for recovering from the economic pain of the coronavirus pandemic. “You’re going to call your own shots,” Trump told the governors. “We’re going to be standing alongside of you.”

Here’s the Machiavellian translation: It’s my mistake, but your headache. It’s election year, you know.

Following the Trump administration’s loss of credibility, many states developed their own exit stances, including “Trump-proof” plans in the Tri-State area. Belated mobilization was devastating not just nursing homes, but prison systems and other dense closed facilities. As perceptive observers noted, this was the next information battle field in America: “Who gets counted in the coronavirus death toll .”

As I argued in The Tragedy of Missed Opportunities, the US mobilization against the pandemic failed, due to a series of factors, including

  • Complacency, belated mobilization, inadequate preparedness, poorly-enforced lockdowns, and failed crisis leadership by the Trump White House;
  • Ineffective monitoring of quarantines and self-quarantines;
  • faulty test kits and long delays in testing, plus deficient contact tracing;
  • huge shortages of personal protective equipment (PPE) that endangered the lives of frontline healthcare professionals;
  • trade war that caused additional, unwarranted PPE shortages;
  • failed responses to the outbreak, which have dramatically added to health risks;
  • misguided media coverage that has contributed to ‘infodemics’;
  • a “paranoid style of politics” to shift the blame on China and the WHO and its executives (and the disastrous decision to exit the US from the WHO)
  • premature exits from lockdowns;
  • and the list goes on.

These mistakes have been followed by Trump’s decision to exit the US from the WHO, which will compound public-health risks in the future, both in the US and worldwide.

But the long-term international implications may prove even worse.

US virus exports into Mexico – and beyond  

What happens in America will not stay in America. Due to months of fattening rather than flattening the curve and the associated resurgence of COVID-19 in the US, international exits from lockdowns and global economic recovery are virtually ensured to take a series of new hits when the US eventually returns back to business.

The recent travel ban by the EU against the United States is just a tip of the iceberg. Mexican border states have raised serious concerns about Americans’ pandemic inflows into the south.

Washington implemented strict inflow protocols against Mexicans in March. Yet, as the virus had its first peak in early spring and is now enjoying its second wave in the US, hundreds of thousands of Americans continue to cross the border into Mexico.

What happens in the US-Mexican border today is just a prelude to what will ensue internationally as US containment failures – followed by secondary virus waves – are likely to be exported around the world.

About the Author:

Dr. Dan Steinbock is an internationally recognized strategist of the multipolar world and the founder of Difference Group. He has served at the India, China and America Institute (USA), Shanghai Institutes for International Studies (China) and the EU Center (Singapore). For more, see https://www.differencegroup.net


How Bali could build a better kind of tourism after the pandemic

By Jaeyeon Choe, Bournemouth University and Rick Stafford, Bournemouth University

COVID-19 has hit tourism-reliant destinations hard. The Indonesian island of Bali, for example, where 70% of the population depend on tourism, has seen extensive job and income losses since it closed its borders in April.

The economic impact so far has been greater than that of the Bali bombings of 2002, with losses of around 9.7 trillion rupiah (about £551.3 million) a month.

In the past, the island’s image as a peaceful paradise with a rich cultural and religious heritage has made it a highly resilient tourist destination. Bali recovered swiftly in the wake of past crises, both natural and man made, including the Gulf War (1990), a cholera outbreak (1995), Sars (2003) and bird flu (2007).

But without significant investment and diversification, there are widespread concerns that this crisis could be different.

A different approach may now be needed to save the tourism industry – and to make sure its benefits are more evenly spread. We believe that now is the time to adjust the model in Bali away from surf, parties, and yoga towards rural villages with high poverty rates across the island (especially the underdeveloped north-east).

To do this, government support is required to build small-scale tourism that will provide new livelihoods. This might include everything from dolphin watching and snorkelling trips, to food tourism and “experience tourism” focused on traditional fishing and farming.

That support does not necessarily need to be in the form of cash. When we interviewed small-business representatives in Bali last year, they called not for financial subsidies, but for marketing training and access to tourism-research data.

As one entrepreneur told us: “Many local creative businesses are managed as informal family businesses. They lack knowledge in professional management and marketing skills.”

He also spoke of the need for improved collaboration between IT experts, business consultants, local universities and policymakers.

Yet there are important risks to consider when attempting to build a new kind of tourism. “Authentic” experiences can often be manufactured by large businesses, preventing regional economic development (other than occasional low-paid work) in the most deprived areas.

And without investment in tourist infrastructure, it would be too easy for tourists to prefer the manufactured version over the true “authenticity” on offer from local communities. Carefully considered investment, however, could lead to sustainable development.

According to Dr Luh Putu Mahyuni, a sustainable business consultant and economist at Undiknas University: “The pandemic provides a wake up call for Bali to foster […] new types of tourism such as gastronomic tourism.”

She told a webinar we hosted in May: “The tourism sector needs to develop products with other sectors so as to create a more resilient and sustainable economy.”

To boost that economy, the island should also consider a tourist tax, while reducing taxes on small-scale home-stays, and better regulating the presence of Airbnb. It also needs to restrict foreign ownership of property, limit destruction of viable farmland and limit business sizes in the south of the island.

An island of opportunity

Notwithstanding all the devastation it has caused, COVID-19 has given the world an opportunity to pause and reflect on how things may change in its aftermath. The tourism industry in Bali (and many other places) is no exception.

For tourism is often seen as a solution to all kinds of problems, from economics to conservation. But as our research has shown, unless tourist money is kept in the local community, the benefits do not materialise.

And besides the major financial concerns on Bali, and the need for a tourism-led recovery, the authorities must also face up to deeply entrenched levels of structural inequality. Poverty, homelessness and dispossession existed long before the pandemic.

The island must learn from what happened 18 years ago, when the bombings led to job losses and increased rates of depression, alcoholism and crime. And we hope that Bali can use the current crisis as an opportunity to look at the causes of such social problems, rather than the symptoms. To move on and build a more resilient island, where responsible tourism plays a major role in alleviating poverty.The Conversation

About the Author:

Jaeyeon Choe, Senior Lecturer in Tourism and Leisure, Bournemouth University and Rick Stafford, Professor of Marine Biology and Conservation, Bournemouth University

This article is republished from The Conversation under a Creative Commons license. Read the original article.


Forex Technical Analysis & Forecast 03.07.2020

Article By RoboForex.com

EURUSD, “Euro vs US Dollar”

EURUSD is forming another descending wave. Possibly, today the pair may break 1.1222 and then continue falling with the short-term target at 1.1180. After that, the instrument may correct to test 1.1222 from below and then start another decline to reach 1.1144.

EURUSD
Risk Warning: the result of previous trading operations do not guarantee the same results in the future

GBPUSD, “Great Britain Pound vs US Dollar”

GBPUSD is forming another descending wave towards 1.2410. Possibly, the pair may correct towards 1.2466 and then resume trading downwards to break 1.2363 and then continue falling inside the downtrend with the target at 1.2317.

GBPUSD
Risk Warning: the result of previous trading operations do not guarantee the same results in the future

USDRUB, “US Dollar vs Russian Ruble”

USDRUB is still trading downwards to reach 69.96. After that, the instrument may resume growing towards 70.50, thus forming a new consolidation range between these two levels. If later the price breaks this range to the upside, the market may form one more ascending structure with the target at 72.00; if to the downside at 0.9490 – resume trading inside the downtrend to reach 68.00.

USDRUB
Risk Warning: the result of previous trading operations do not guarantee the same results in the future

USDJPY, “US Dollar vs Japanese Yen”

USDJPY is consolidating around 107.46 without any particular direction. If later the price breaks this range to the upside at 107.75, the market may start a new growth with the target at 108.20; if to the downside at 107.20 – resume trading downwards to reach 106.60.

USDJPY
Risk Warning: the result of previous trading operations do not guarantee the same results in the future

USDCHF, “US Dollar vs Swiss Franc”

USDCHF is forming another ascending wave towards 0.9494. After that, the instrument may correct to reach 0.9455 and then resume trading upwards with the predicted target at 0.9555.

USDCHF
Risk Warning: the result of previous trading operations do not guarantee the same results in the future

AUDUSD, “Australian Dollar vs US Dollar”

AUDUSD is still consolidating around 0.6902. If later the price breaks this range to the upside at 0.6940, the market may form another ascending structure with the target at 0.6990 or even 0.7000; if to the downside at 0.6900 – resume trading downwards to reach 0.6880 or even 0.6788.

AUDUSD
Risk Warning: the result of previous trading operations do not guarantee the same results in the future

BRENT

Brent is forming one more ascending wave towards 43.40. Later, the market may fall to reach 42.40 and then start another growth to return to 43.40 or even continue the uptrend with the target at 45.20.

BRENT
Risk Warning: the result of previous trading operations do not guarantee the same results in the future

XAUUSD, “Gold vs US Dollar”

Gold is still consolidating around 1770.00. Today, the pair may test 1768.20 from above and then resume trading upwards to reach 1793.00 or even 1800.00.

GOLD
Risk Warning: the result of previous trading operations do not guarantee the same results in the future

BTCUSD, “Bitcoin vs US Dollar”

After finishing the descending impulse at 9000.00, BTCUSD is consolidating above this level. Possibly, the pair may fall towards 8700.00 and then start a new correction to reach 9200.00. Later, the market may continue trading downwards with the target at 8000.00.

BITCOIN
Risk Warning: the result of previous trading operations do not guarantee the same results in the future

S&P 500

After completing the ascending wave at 3160.6, the Index is expected to correct towards 3076.0. After that, the instrument may resume trading upwards with the target at 3125.0.

S&P 500

Article By RoboForex.com

Attention!
Forecasts presented in this section only reflect the author’s private opinion and should not be considered as guidance for trading. RoboForex LP bears no responsibility for trading results based on trading recommendations described in these analytical reviews.