Author Archive for InvestMacro – Page 13

Prepare for the global impact of US COVID-19 resurgence

By Dan Steinbock

– Recently, the US has suffered a series of COVID-19 surges. The escalation won’t stay in America. It is likely to cause collateral damage worldwide.  

In early June, US states began to exit from the lockdown measures, even though the epidemic curve had not been adequately flattened. On July 4th, the White House sought for a “return to normal” with a celebration at Mount Rushmore.

Once again, the Trump crowds were not required to wear face masks or practice social distancing, although the US has recently tallied its highest single-day totals of coronavirus infections.

Confirmed virus cases in the US could exceed 4 million after mid-July, with over 140,000 deaths, while new cases average over 50,000 daily.

As a result of crisis mishandling, U.S. GDP growth suffered a -5% contraction in the 1st quarter, which is likely to be followed by a historical -53% plunge in the 2nd quarter.

The COVID-19 surge across America is no surprise, however. It was only to be expected in light of the catastrophic mishandling of the pandemic by the White House, as projected in my report, The Tragedy of Missed Opportunities in April (Shanghai Institutes for International Studies).

Massive failure, huge human and economic costs

On January 3, when the virus gene sequencing was completed by China’s CDC and emergency monitoring initiated, Chinese officials notified WHO. That’s when US CDC director Dr. Robert R. Redfield called Alex M. Azar II, secretary of health, telling him that China had potentially discovered a new coronavirus.

Yet, no proactive mobilization occurred. Instead, a long debate began within the Trump administration over “what to tell to the American public.”

By the WHO’s announcement of the international emergency (Jan 30, 2020), first cases were also recorded in 20 countries worldwide, including the US. But again, the Trump White House chose not to mobilize.

Even when the epicenter moved from Europe to the US, the White House delayed full response. It was only after March 10, when the WHO declared the virus a pandemic that the White House began to mobilize federal resources against the outbreak – over 2 months belatedly and ineffectively.

To win re-election, the Trump administration has tried to evade responsibility by blaming WHO and China for its mistakes. Yet, US COVID-19 mobilization failed, due to complacency, belated mobilization, inadequate preparedness, poorly-enforced lockdowns, premature exits from quarantines, failed leadership, and the list goes on.

Worse, Trump’s decision to exit the US from the WHO will compound public-health risks in the future, both in the US and worldwide. But the long-term international implications may prove even worse.

Beware of US virus exports  

What happens in America will not stay in America. Due to months of fattening rather than flattening the curve and the associated resurgence of COVID-19 in the US, international exits from lockdowns and global economic recovery are virtually ensured to take a series of new hits when the US eventually returns back to business.

The recent travel ban by the EU against the United States is just a tip of the iceberg. Mexican border states have raised serious concerns about Americans’ pandemic inflows into the south.

Washington implemented strict inflow protocols against Mexicans in March. Yet, as the virus had its first peak in early spring and is now enjoying its second wave in the US, Americans continue to cross the border into Mexico.

What happens in the US-Mexican border today is just a prelude to what will ensue internationally as US containment failures – followed by secondary virus waves – are likely to be exported around the world.

About the Author:

Dr. Dan Steinbock is an internationally recognized strategist of the multipolar world and the founder of Difference Group. He has served at the India, China and America Institute (USA), Shanghai Institutes for International Studies (China) and the EU Center (Singapore). For more, see https://www.differencegroup.net


The perfect storm brewing for company pensions

By George Prior

Company pensions are becoming increasingly unsustainable due to the plunge in government bond yields and low interest rates, warns the CEO of one of the world’s largest financial advisory and fintech organizations.

The warning from Nigel Green comes as the yields of government securities – in which pension funds heavily invest – have fallen dramatically since the coronavirus crisis.

Mr Green says: “Institutional investors, such as pension funds, have always traditionally invested in government bonds, as they’re widely regarded as a safe-haven.

“However, the world has changed considerably in six months.

“Around the world, government bond yields are plunging as a direct result of the record-breaking asset purchase schemes introduced by central banks to help ease a severe worldwide economic slump due to the pandemic.
“And as the historic stimulus is set to remain, or even be expanded, the pressure on bond yields is expected to intensify.”

He continues: “The far-reaching stimulus agendas and more than a decade of ultra-low interest rates – which could be going even lower – are creating a perfect storm for company pensions, which are already feeling the squeeze of ballooning deficits.

“Increasingly, no longer are government bonds delivering the returns required to fulfil the obligations made to retirement savers.”

The deVere CEO also underscores the ongoing issues of the wider bond market.

“The falling yields have forced pension funds, and other institutional investors, to make highly unusual changes to their asset allocation mix as they seek out better returns in riskier assets.

“But then, the question is: If pension funds don’t buy government bonds, who will?

“China has been a major purchaser of U.S. bonds in the past to keep its export prices down. With its $1trn of Treasurys it’s the number two holder.

“But the new economic realities and geopolitical tensions have prompted Beijing to shed some of its U.S. bonds. In March alone, China sold $8bn of its hoard – in the same month as overseas investors and central banks got rid of $300 billion of Treasurys to raise dollars.”

Mr Green concludes: “Typically, bonds account for more than half of the assets held by pension schemes.

“Due to the falling bond yields, the potential for negative interest rates, and the already chronic deficits, company pension holders should seek with their adviser the available ways to safeguard their retirement income.”

About:

deVere Group is one of the world’s largest independent advisors of specialist global financial solutions to international, local mass affluent, and high-net-worth clients.  It has a network of more than 70 offices across the world, over 80,000 clients and $12bn under advisement.

Fibonacci Retracements Analysis 13.07.2020 (GOLD, USDCHF)

Article By RoboForex.com

XAUUSD, “Gold vs US Dollar”

As we can see in the H4 chart, over the past week, XAUUSD managed to fix above the broken high at 1764.86 and reach 1800.00. From the technical point of view, the chart shows that the pair has already reached the post-correctional extension area between 138.2% and 161.8% fibo at 1800.60 and 1823.00 respectively. After breaking this area, the instrument may try to attack its all-time high at 1920.66. However, a divergence on MACD indicates a possible pullback. The key support is at 1670.60.

GOLD_H4
Risk Warning: the result of previous trading operations do not guarantee the same results in the future

In the H1 chart, after completing the rising wave, the pair is correcting downwards. By now, it has already reached 38.2% fibo and may later continue towards 50.0% fibo at 1787.50. If the price breaks the high at 1817.89, the instrument may continue the current bullish tendency.

GOLD_H1
Risk Warning: the result of previous trading operations do not guarantee the same results in the future

USDCHF, “US Dollar vs Swiss Franc”

As we can see in the H4 chart, after breaking its previous low at 0.9367, USDCHF continues falling towards the mid-term 76.0% at 0.9350. At the same time, there is a convergence on MACD, which may indicate a possible pullback soon. However, the key downside target remains the low at 0.9176.

USDCHF_H4
Risk Warning: the result of previous trading operations do not guarantee the same results in the future

In the H4 chart, after correcting towards 0.9553, which is now a resistance level, the pair is moving downwards. The key short-term downside targets are inside the local post-correctional extension area between 138.2% and 161.8% fibo at 0.9309 and 0.9267 respectively. However, the convergence on MACD may indicate a slowdown in the current descending tendency.

USDCHF_H1

Article By RoboForex.com

Attention!
Forecasts presented in this section only reflect the author’s private opinion and should not be considered as guidance for trading. RoboForex LP bears no responsibility for trading results based on trading recommendations described in these analytical reviews.

The Analytical Overview of the Main Currency Pairs on 2020.07.13

by JustForex

The EUR/USD currency pair

Technical indicators of the currency pair:
  • Prev Open: 1.12834
  • Open: 1.13023
  • % chg. over the last day: +0.15
  • Day’s range: 1.13009  – 1.13361
  • 52 wk range: 1.0777  – 1.1494

The EUR/USD currency pair is consolidating. The technical pattern is ambiguous. Sentiment in the financial markets continues to deteriorate amid the second wave of the COVID-19 epidemic. The World Health Organization reported a record 230,370 new cases last Sunday. The number of infected in the world has reached 13 million. At the moment, EUR/USD quotes are testing local support and resistance levels: 1.1300 and 1.1335, respectively. The single currency is tending to decline. Positions should be opened from key support and resistance levels.

Today, the publication of important economic releases is not expected.

EUR/USD

Indicators do not give accurate signals: the price has crossed 50 MA.

The MACD histogram is in the positive zone, but below the signal line, which gives a weak signal to buy EUR/USD.

Stochastic Oscillator is in the neutral zone, the %K line is below the %D line, which indicates the bearish sentiment.

Trading recommendations
  • Support levels: 1.1300, 1.1260, 1.1220
  • Resistance levels: 1.1335, 1.1365

If the price fixes below 1.1300, EUR/USD quotes are expected to fall. The movement is tending to 1.1260-1.1240.

An alternative could be the growth of the EUR/USD currency pair to 1.1360-1.1380.

The GBP/USD currency pair

Technical indicators of the currency pair:
  • Prev Open: 1.26063
  • Open: 1.26203
  • % chg. over the last day: +0.12
  • Day’s range: 1.25917  – 1.26662
  • 52 wk range: 1.1466  – 1.3516

GBP/USD quotes are in a sideways trend. There is no defined trend. Financial market participants expect additional drivers. The British pound is testing the key support and resistance levels: 1.2580 and 1.2665, respectively. The demand for risky assets has weakened. The GBP/USD currency pair is tending to decline. Positions should be opened from key levels.

We recommend paying attention to the speech by the head of the Bank of England.

GBP/USD

Indicators do not give accurate signals: the price has crossed 50 MA.

The MACD histogram is near the 0 mark.

Stochastic Oscillator is in the neutral zone, the %K line is below the %D line, which indicates the bearish sentiment.

Trading recommendations
  • Support levels: 1.2580, 1.2520, 1.2470
  • Resistance levels: 1.2665, 1.2700

If the price fixes below 1.2580, GBP/USD quotes are expected to correct. The movement is tending to the round level of 1.2500.

An alternative could be the growth of the GBP/USD currency pair to 1.2700-1.2720.

The USD/CAD currency pair

Technical indicators of the currency pair:
  • Prev Open: 1.35872
  • Open: 1.35851
  • % chg. over the last day: -0.01
  • Day’s range: 1.35552  – 1.36024
  • 52 wk range: 1.2949  – 1.4668

There is an ambiguous technical pattern on the USD/CAD currency pair. The loonie is consolidating. Investors expect additional drivers. The local support and resistance levels are 1.3555 and 1.3585, respectively. We recommend paying attention to the dynamics of “black gold” prices. Positions should be opened from key levels.

The news feed on Canada’s economy is calm.

USD/CAD

Indicators do not give accurate signals: the price has crossed 50 MA and 100 MA.

The MACD histogram has been declining, which gives a signal to sell USD/CAD.

Stochastic Oscillator is in the neutral zone, the %K line is above the %D line, which indicates the bullish sentiment.

Trading recommendations
  • Support levels: 1.3555, 1.3520, 1.3490
  • Resistance levels: 1.3585, 1.3625

If the price fixes above 1.3585, USD/CAD quotes are expected to rise. The movement is tending to 1.3620-1.3640.

An alternative could be a decrease in the USD/CAD currency pair to 1.3520-1.3500.

The USD/JPY currency pair

Technical indicators of the currency pair:
  • Prev Open: 107.149
  • Open: 106.884
  • % chg. over the last day: -0.28
  • Day’s range: 106.787  – 107.096
  • 52 wk range: 101.19  – 112.41

USD/JPY quotes have become stable. A trading instrument is consolidating. The local support and resistance levels are 106.80 and 107.10, respectively. The technical pattern signals a possible correction of the USD/JPY currency pair. We recommend paying attention to the dynamics of US government bonds yield. Positions should be opened from key levels.

The news feed on Japan’s economy is quite calm.

USD/JPY

Indicators do not give accurate signals: the price has crossed 50 MA.

The MACD histogram is near the 0 mark.

Stochastic Oscillator is in the overbought zone, the %K line has crossed the %D line. There are no signals at the moment.

Trading recommendations
  • Support levels: 106.80, 106.65
  • Resistance levels: 107.10, 107.35, 107.60

If the price fixes below 106.80, a further drop in USD/JPY quotes is expected. The movement is tending to 106.50-106.30.

An alternative could be the growth of the USD/JPY currency pair to 107.30-107.50.

by JustForex

Forex Technical Analysis & Forecast 13.07.2020

Article By RoboForex.com

EURUSD, “Euro vs US Dollar”

After completing the descending wave at 1.1255, EURUSD is moving upwards to reach 1.1338. Possibly, the pair may reach it and then form a new descending structure towards 1.1300. After that, the instrument may start another growth to reach 1.1380 and then resume trading downwards with the target at 1.1225.

EURUSD
Risk Warning: the result of previous trading operations do not guarantee the same results in the future

GBPUSD, “Great Britain Pound vs US Dollar”

GBPUSD is moving upwards. Possibly, today the pair may reach 1.2694 and then fall towards 1.2640. Later, the market may form one more ascending structure to reach 1.2712 and then start a new decline with the target at 1.2585.

GBPUSD
Risk Warning: the result of previous trading operations do not guarantee the same results in the future

USDRUB, “US Dollar vs Russian Ruble”

USDRUB is still falling towards 70.20. Later, the market may form one more ascending structure to reach 70.90 and then start a new decline with the first target at 69.50.

USDRUB
Risk Warning: the result of previous trading operations do not guarantee the same results in the future

USDJPY, “US Dollar vs Japanese Yen”

USDJPY has finished the ascending wave at 106.93; right now, it is falling. Possibly, the pair may form a new descending structure towards 106.55 and then start another correction to the upside with the first target at 107.17.

USDJPY
Risk Warning: the result of previous trading operations do not guarantee the same results in the future

USDCHF, “US Dollar vs Swiss Franc”

After finishing the descending wave at 0.9399, USDCHF is expected to continue falling towards 0.9377. After that, the instrument may grow to reach 0.9440 and then resume trading inside the downtrend to return to 0.9399.

USDCHF
Risk Warning: the result of previous trading operations do not guarantee the same results in the future

AUDUSD, “Australian Dollar vs US Dollar”

After breaking 0.6960 to the upside, AUDUSD is still growing and may form one more ascending structure to reach 0.6994. Later, the market may start a new decline towards 0.6965 and then resume trading upwards with the target at 0.7000.

AUDUSD
Risk Warning: the result of previous trading operations do not guarantee the same results in the future

BRENT

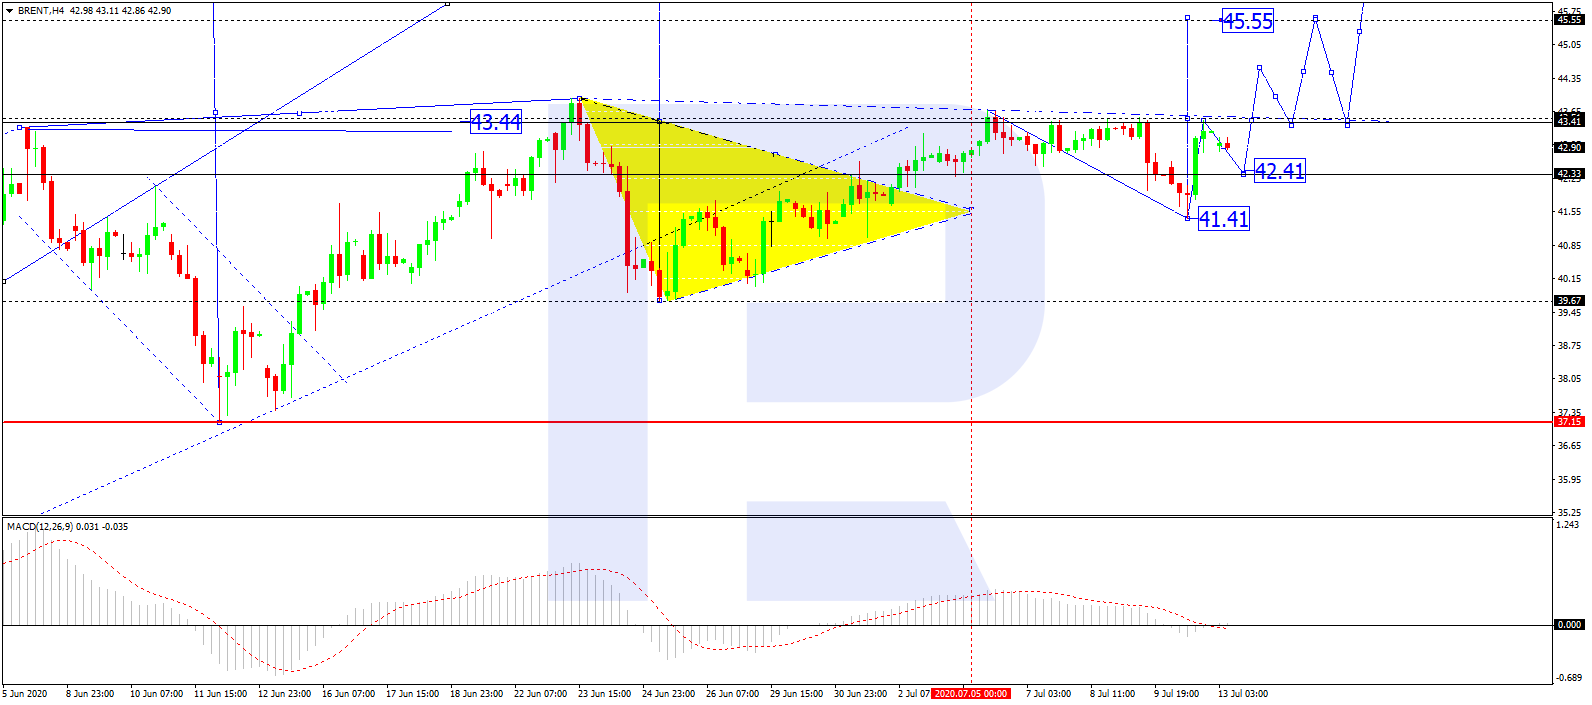
After finishing the correction at 41.41, Brent has completed another ascending impulse towards 43.50. Today, the asset may form a new descending structure towards 42.50 and then grow to break 43.50. After that, the instrument may continue moving upwards with the short-term target at 44.55.

BRENT
Risk Warning: the result of previous trading operations do not guarantee the same results in the future

XAUUSD, “Gold vs US Dollar”

After falling and reaching 1794.00, Gold is correcting towards 1805.50. Later, the market may form a new descending structure with the first target at 1792.50 and then start another correction to return to 1805.50.

GOLD
Risk Warning: the result of previous trading operations do not guarantee the same results in the future

BTCUSD, “Bitcoin vs US Dollar”

BTCUSD is consolidating around 9260.00. Today, the pair may fall towards 9060.00 and then form one more ascending structure to reach 9190.00. After that, the instrument may start a new decline with the short-term target at 8700.00.

BITCOIN
Risk Warning: the result of previous trading operations do not guarantee the same results in the future

S&P 500

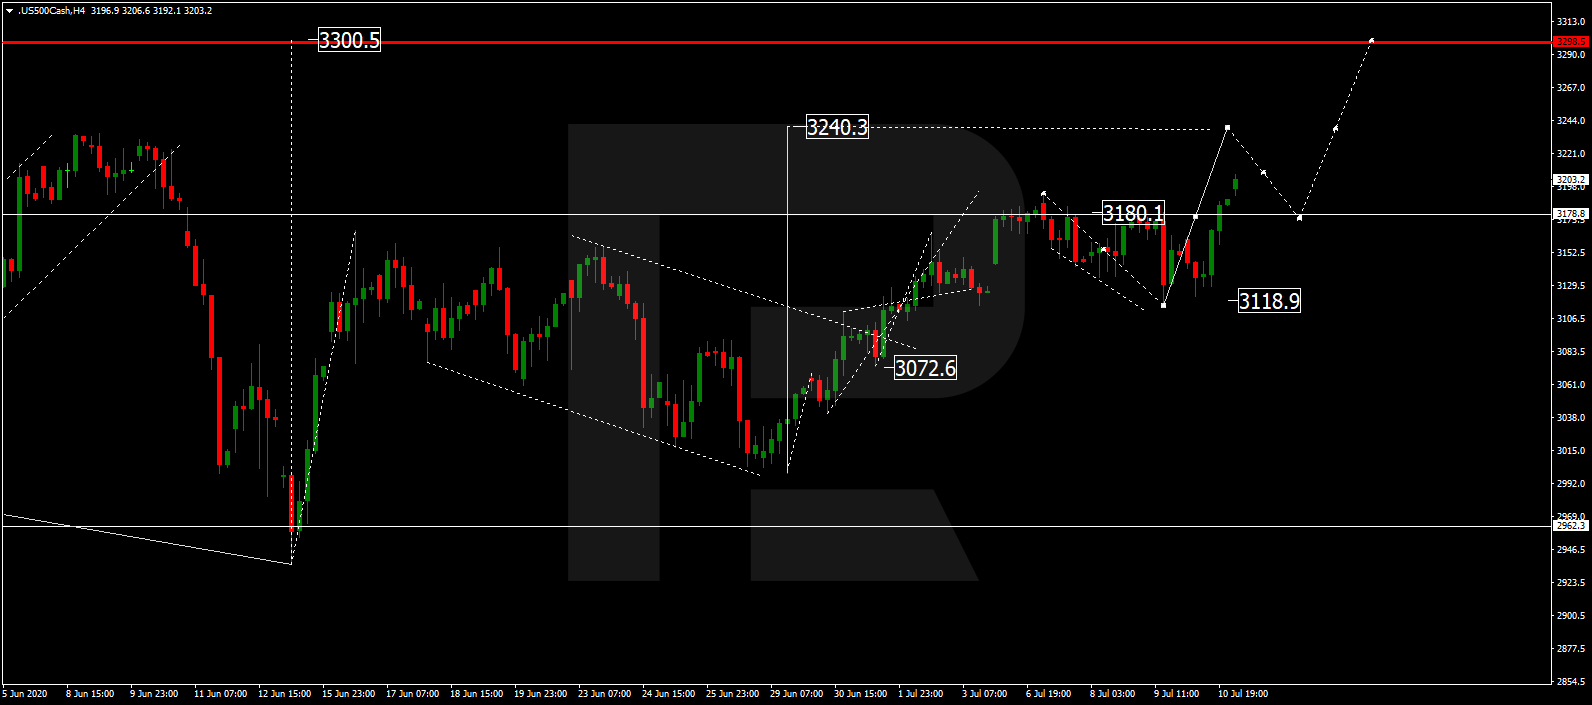
After breaking 3180.1 to the upside, the Index may continue growing towards 3240.5. After that, the instrument may correct to return to 3180.1 and then form one more ascending structure to reach 3300.5. Later, the market may resume trading downwards with the first target at 3100.6.

S&P 500

Article By RoboForex.com

Attention!
Forecasts presented in this section only reflect the author’s private opinion and should not be considered as guidance for trading. RoboForex LP bears no responsibility for trading results based on trading recommendations described in these analytical reviews.

DAX30 bears about to take over: under 12,000 this week?

By Admiral Markets

Economic events

Source: Economic Events July 13, 2020 – Admiral Markets’ Forex Calendar

The DAX30 bulls had (and will have) to deal with some serious headwinds, beginning early last Friday, for the new week of trading.

The German index seriously attacked and dropped below the short-term important support level of around 12,470/500 points.

Above that level, another stint up to 12,750 and towards the June highs around 12,900 points was once possible, but this outlook has now darkened.

With rising fears around new Corona infections in the US, especially in Texas and Florida which together are responsible for over 20% of the annual US GDP, and that another lockdown of the US economy could be imminent, placing the advantage more and more with the bears.

And with the very extended mode in the Nasdaq100, mainly driven by the “Big 5” of Apple, Amazon, Microsoft, Facebook, and Google, following a positive Thursday while 392 stocks in the SP500 declined, the market is screaming for a correction which would potentially drive Equities as a whole significantly lower, and the DAX30 could be headed for a weak start into the week.

What’s certainly interesting is that the German index finds a solid support around 12,370/400 points.

If we break lower here and close below that level, the path for another stint below 12,000 points in the days to come could be levelled:

DAX30 CFD Hourly chart

Source: Admiral Markets MT5 with MT5-SE Add-on DAX30 CFD Hourly chart (between June 23, 2020, to July 10, 2020). Accessed: July 10, 2020, at 10:00pm GMT

DAX30 daily chart

Source: Admiral Markets MT5 with MT5-SE Add-on DAX30 CFD Daily chart (between March 27, 2019, to July 10, 2020). Accessed: July 10, 2020, at 10:00pm GMT – Please note: Past performance is not a reliable indicator of future results, or future performance.

In 2015, the value of the DAX30 CFD increased by 9.56%, in 2016, it increased by 6.87%, in 2017, it increased by 12.51%, in 2018, it fell by 18.26%, in 2019, it increased by 26.44% meaning that after five years, it was up by 34.2%.

Check out Admiral Markets’ most competitive conditions on the DAX30 CFD and start trading on the DAX30 CFD with a low 0.8 point spread offering during the main Xetra trading hours!

Discover the world’s #1 multi-asset platform

Admiral Markets offers professional traders the ability to trade with a custom, upgraded version of MetaTrader 5, allowing you to experience trading at a significantly higher, more rewarding level. Experience benefits such as the addition of the Market Heat Map, so you can compare various currency pairs to see which ones might be lucrative investments, access real-time trading data, and so much more. Click the banner below to start your FREE download of MT5 Supreme Edition!

Download MetaTrader 5 and begin trading today!

Disclaimer: The given data provides additional information regarding all analysis, estimates, prognosis, forecasts or other similar assessments or information (hereinafter “Analysis”) published on the website of Admiral Markets. Before making any investment decisions please pay close attention to the following:

  1. This is a marketing communication. The analysis is published for informative purposes only and are in no way to be construed as investment advice or recommendation. It has not been prepared in accordance with legal requirements designed to promote the independence of investment research, and that it is not subject to any prohibition on dealing ahead of the dissemination of investment research.
  2. Any investment decision is made by each client alone whereas Admiral Markets shall not be responsible for any loss or damage arising from any such decision, whether or not based on the Analysis.
  3. Each of the Analysis is prepared by an independent analyst (Jens Klatt, Professional Trader and Analyst, hereinafter “Author”) based on the Author’s personal estimations.
  4. To ensure that the interests of the clients would be protected and objectivity of the Analysis would not be damaged Admiral Markets has established relevant internal procedures for prevention and management of conflicts of interest.
  5. Whilst every reasonable effort is taken to ensure that all sources of the Analysis are reliable and that all information is presented, as much as possible, in an understandable, timely, precise and complete manner, Admiral Markets does not guarantee the accuracy or completeness of any information contained within the Analysis. The presented figures refer that refer to any past performance is not a reliable indicator of future results.
  6. The contents of the Analysis should not be construed as an express or implied promise, guarantee or implication by Admiral Markets that the client shall profit from the strategies therein or that losses in connection therewith may or shall be limited.
  7. Any kind of previous or modeled performance of financial instruments indicated within the Publication should not be construed as an express or implied promise, guarantee or implication by Admiral Markets for any future performance. The value of the financial instrument may both increase and decrease and the preservation of the asset value is not guaranteed.
  8. The projections included in the Analysis may be subject to additional fees, taxes or other charges, depending on the subject of the Publication. The price list applicable to the services provided by Admiral Markets is publicly available from the website of Admiral Markets.

Leveraged products (including contracts for difference) are speculative in nature and may result in losses or profit. Before you start trading, you should make sure that you understand all the risks.

By Admiral Markets

Oil Bulls Are Very Hesitant

By Dmitriy Gurkovskiy, Chief Analyst at RoboForex

On Monday, July 13th, Brent is falling and trading at $42.93. Basically, if one remembers the oil price this spring, the current value is quite stable. However, market players can’t be sure in anything, neither the oil price surge amid the increasing demand, nor the lack of demand and, as a result, predictable oil sales.

The latest data from Baker Hughes showed that the number of oil rigs in the United States fell again and on July 10th, was equal to 181 units. And now just feel the difference – at the same period of time last year, the reading was 784 units. The total rig count in the country is 258 units.

Early in the week, financial markets are anticipated to be pretty quiet but getting more and more dynamic as the trading week unfolds. For example, market players will closely follow the US comments relating to a possible resumption of trade talks with China because any negative news here may quickly become a reason for oil investors to sell the “black gold”.

In the H4 chart, after finishing the correction at 41.41, Brent is forming a new ascending impulse towards 43.50. After reaching this level, the instrument may start another correction. However, if the price breaks 43.50 to the upside, the pair may continue trading upwards with the short-term target at 45.55. From the technical point of view, this scenario is confirmed by MACD Oscillator: its signal line is moving close to 0. Later, the line is expected to rebound from 0 and resume moving upwards.

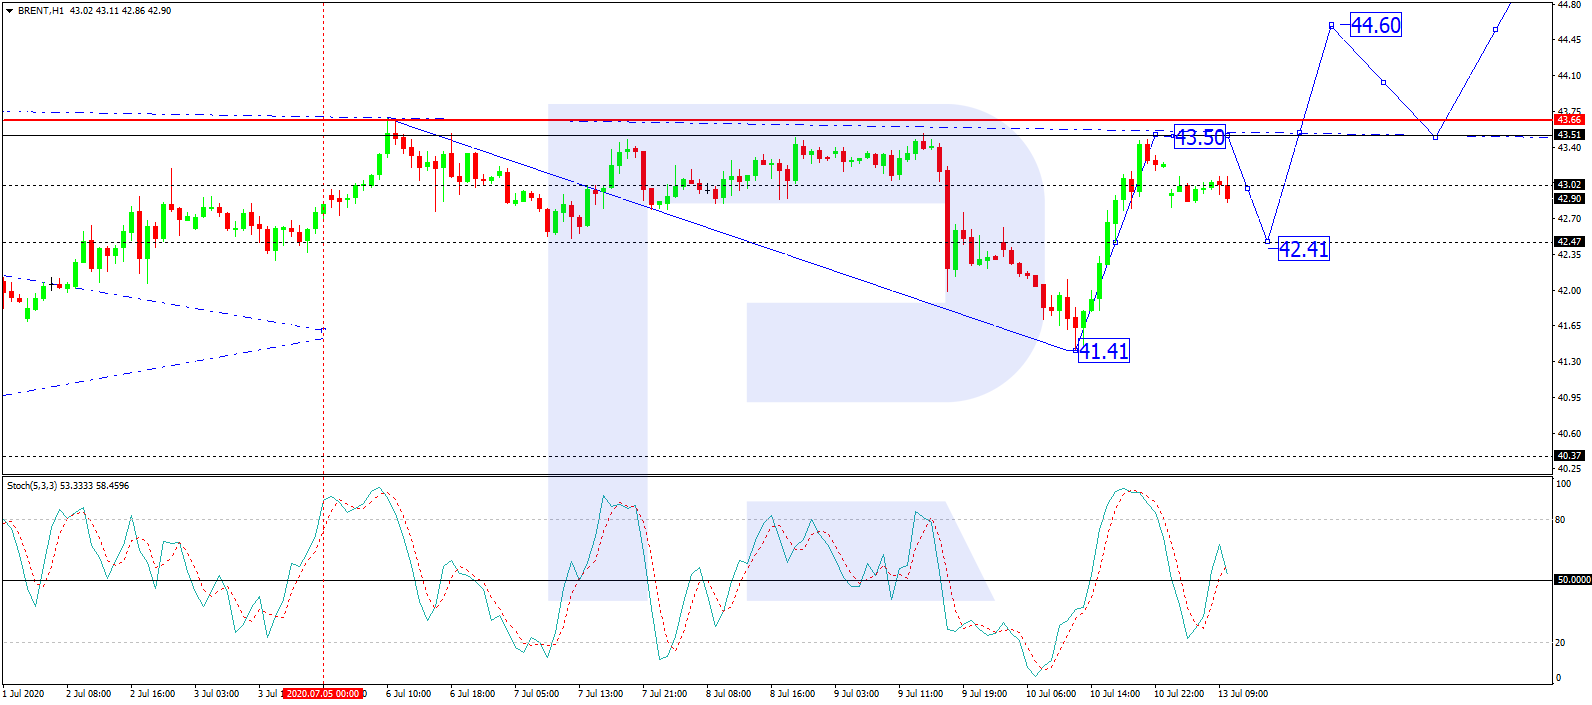
As we can see in the H1 chart, Brent is consolidating around 43.00. Today, the pair may fall to expand the range down to 42.42 and complete the correction. After that, the instrument may start a new growth to reach 43.50. From the technical point of view, this idea is confirmed by Stochastic Oscillator: its signal line has broken 80; right now, it is moving near 50 and may continue falling to reach 20, thus implying a possible decline towards 42.42 on the price chart. Later, when the indicator resumes growing towards 80, the price chart may resume trading upwards as well and reach 43.50.

Disclaimer

Any predictions contained herein are based on the author’s particular opinion. This analysis shall not be treated as trading advice. RoboForex shall not be held liable for the results of the trades arising from relying upon trading recommendations and reviews contained herein.


COVID-19 exposes why the Postal Service needs to get back into the banking business

By Melanie G. Long, The College of Wooster

Financial services play a major role in the economic lives of most Americans, from the moment their paychecks are directly deposited into a bank account to the loan taken out to buy their first home or car.

Yet over 12 million people – about 6% of U.S. adults – cannot access these services because they do not have a bank account. Economists call these individuals financially excluded or the “unbanked.” Being unbanked is costly, both financially and in terms of missed economic opportunities, and afflicts communities of color most.

The coronavirus recession exposes these costs even further. For example, the unbanked have had to wait much longer than those with accounts to get “economic impact” checks – and some are still waiting. Prompt access to emergency lending is vital to helping poorer Americans endure the crisis.

As an economist who studies financial exclusion, I believe there’s a solution to the problem, and one that the U.S. has tried before: postal banking.

The costs of financial exclusion

Financial exclusion is not a new problem.

Its roots in the U.S. can be traced back to the New Deal’s Federal Housing Administration, which limited mortgage lending to middle-income, predominantly white suburbs. The problem grew worse in the 1980s and ‘90s, when deregulation allowed banks to operate across state lines, leading to a decline in the number of community banks. National banks were less willing to lend in low-income neighborhoods.

Today, Black and Hispanic Americans are three times more likely to be unbanked than whites. This is partly because the number of bank branches in communities of color and low-income communities has fallen. Overall, the number of bank branches has shrunk by 6% since 2012.

While some people avoid banks because of the fees, being left out of the banking system has other costs. With less access to other lines of credit, the unbanked are more likely to use expensive alternatives such as title loans – in which a borrower uses a vehicle title as collateral – for emergency expenses. Annual interest rates on such loans can be as high as 300%.

And being unbanked means it’s harder to develop a credit history. Without one, it is more difficult to get a mortgage loan – and thus much harder to buy a home.

Black Americans in particular are more likely to lack credit scores and are 40% less likely to be homeowners. Since homeownership is one of the main sources of wealth for middle-class Americans, this contributes to the large racial wealth gap.

COVID-19: Worse for the unbanked

The COVID-19 pandemic, by causing a dramatic collapse in economic activity and skyrocketing unemployment rates, has compounded these problems.

Even in good times, more than 10% of Americans report they are unable to pay for an unexpected US$400 expense – and would struggle even more without access to credit.

Those without a banking account have even fewer options to get emergency cash, such as title or payday loans. Another option, which my research shows is especially true among women of color, is asking friends or family for money. Yet with unemployment rates reaching a staggering 19.5% for Hispanic women and 17.5% for black women, community resources will be stretched thin.

[Get the best of The Conversation, every weekend. Sign up for our weekly newsletter.]

Financial exclusion also hampered the rollout of part of the coronavirus bailout that promised stimulus payments of up to $3,400 per family. Americans with checking accounts received the payment within a few weeks via direct deposit, while those without one had to wait far longer. As of early June, 13 to 18 million Americans who were expecting a check still had not received one.

This delay is more than an inconvenience for households living paycheck to paycheck. Many Americans urgently need prescriptions they can’t afford and are at risk of being evicted from their homes.

How postal banking works

Conventional banks claim they cannot serve the unbanked because small-dollar loans and accounts with low balances aren’t profitable.

Postal banking, however, could serve the unbanked and do so efficiently. While there are various ways to do this, a basic postal banking system would allow every United States Postal Service branch to act as a limited-service bank, offering services like checking and saving accounts, pre-paid debit cards and small loans.

As a public corporation that doesn’t need to worry about rewarding investors, the USPS could offer financial services to more Americans at a lower cost than banks. USPS branches are already located in virtually every neighborhood in the U.S., and over half are in banking deserts. This existing network would reduce overhead. And the USPS is in a better position to handle a loan default because it could garnish tax refunds, reducing the cost of collecting on unpaid loans.

What’s more, this would also offer a financial lifeline to the postal service, which has been losing money for over a decade. The USPS predicts that offering postal banking services could provide between $8 billion and $10 billion in additional revenue a year, which would offset at least some of its current shortfall.

A Postal Savings Certificate of Deposit from 1941.
Smithsonian National Postal Museum, CC BY

History and current practice show that postal banking is feasible. It is already used in 139 countries around the world, such as France, New Zealand and Italy.

And in the U.S., Congress created a government-guaranteed savings scheme in 1910 to encourage people to put their money in the financial system – as opposed to their mattresses and cookie jars. According to “How the Other Half Banks,” by banking law expert Mehrsa Baradaran, the United States Postal Savings System was quite popular. As its peak, it held $3.4 billion in deposits.

But after World War II, conventional banks began to offer much higher interest rates on their deposits – with the same government guarantee. And banks began to open up branches in more underserved neighborhoods. The postal savings system stopped taking new deposits in 1966.

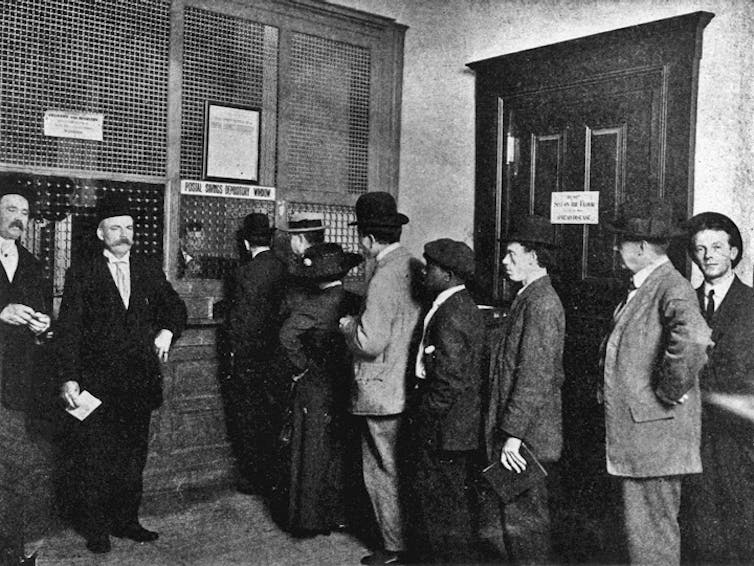
Depositors stand in a queue at a postal savings window.
Smithsonian National Postal Museum, CC BY

Reducing financial service inequality

Now, a growing chorus of voices suggests the time has come to bring it back.

The details differ from proposal to proposal. Some proponents – including USPS itself – see postal banking as a complement to private sector banks, which would continue to offer a wider range of services. Others support a public bank that would compete directly with private banks through a financial services marketplace.

Banks, including small community banks, have generally opposed postal banking. Yet the experience of other countries suggests that a postal bank can coexist with a thriving financial services industry – while ensuring fewer Americans are left behind.The Conversation

About the Author:

Melanie G. Long, Assistant Professor of Economics, The College of Wooster

This article is republished from The Conversation under a Creative Commons license. Read the original article.


Forex Technical Analysis & Forecast 10.07.2020

Article By RoboForex.com

EURUSD, “Euro vs US Dollar”

After completing the ascending wave at 1.1370 and the descending structure towards 1.1300, EURUSD has formed the consolidation range around the latter level and broken it to the downside. Possibly, the pair may form a new descending structure to reach 1.1250 and then resume trading upwards with the target at 1.1300.

EURUSD
Risk Warning: the result of previous trading operations do not guarantee the same results in the future

GBPUSD, “Great Britain Pound vs US Dollar”

After finishing the ascending wave at 1.2668, GBPUSD has completed the descending impulse towards 1.2600; right now. it is consolidating around the latter level. Possibly, today the pair may fall to reach 1.2575 and then return to 1.2600. If later the price breaks this range to the upside, the market may correct towards 1.2640; if to the downside – start a new decline with the target at 1.2530.

GBPUSD
Risk Warning: the result of previous trading operations do not guarantee the same results in the future

USDRUB, “US Dollar vs Russian Ruble”

USDRUB is still trading around 71.01. Today, the pair may fall to break 70.10 and then continue trading downwards to reach 69.60. However, an alternative scenario suggests that the market may form one more ascending correction with the target at 71.60.

USDRUB
Risk Warning: the result of previous trading operations do not guarantee the same results in the future

USDJPY, “US Dollar vs Japanese Yen”

USDJPY has finished the descending wave at 106.99; right now, it is consolidating around this level. If later the price breaks this range to the upside, the market may correct towards 107.40; if to the downside – resume trading inside the downtrend with the target at 106.60.

USDJPY
Risk Warning: the result of previous trading operations do not guarantee the same results in the future

USDCHF, “US Dollar vs Swiss Franc”

After forming the consolidation range around 0.9380 and breaking it to the upside, USDCHF is expected to continue growing towards 0.9440. After that, the instrument may resume trading inside the downtrend with the target at 0.9400.

USDCHF
Risk Warning: the result of previous trading operations do not guarantee the same results in the future

AUDUSD, “Australian Dollar vs US Dollar”

After completing the descending wave at 0.6939, AUDUSD is expected to consolidate around this level. Later, the market may break the range to the upside and start another correction towards 0.6969 or even 0.7004.

AUDUSD
Risk Warning: the result of previous trading operations do not guarantee the same results in the future

BRENT

Brent has finished the descending wave at 42.32. Today, the asset may form a new descending structure towards 41.90 and then consolidate around it. After that, the instrument may break the range to the upside and resume moving upwards with the target at 43.00 or even 43.90.

BRENT
Risk Warning: the result of previous trading operations do not guarantee the same results in the future

XAUUSD, “Gold vs US Dollar”

After falling and reaching 1800.00, Gold is consolidating around it. If later the price breaks this range to the upside, the market may correct towards 1809.90 and then resume trading downwards to break 1785.00. The short-term target is at 1775.55.

GOLD
Risk Warning: the result of previous trading operations do not guarantee the same results in the future

BTCUSD, “Bitcoin vs US Dollar”

BTCUSD is falling towards 9099.00. Later, the market may form one more ascending structure to reach 9260.00 and then start a new decline with the target at 9059.00.

BITCOIN
Risk Warning: the result of previous trading operations do not guarantee the same results in the future

S&P 500

After completing the descending structure at 3118.5 and returning to 3160.6, the Index is expected to consolidate between these two levels. If later the price breaks this range to the upside, the market may form one more ascending structure towards 3240.5; if to the downside – resume trading downwards with the target at 3072.2.

S&P 500

Article By RoboForex.com

Attention!
Forecasts presented in this section only reflect the author’s private opinion and should not be considered as guidance for trading. RoboForex LP bears no responsibility for trading results based on trading recommendations described in these analytical reviews.

Fibonacci Retracements Analysis 10.07.2020 (BITCOIN, ETHEREUM)

Article By RoboForex.com

BTCUSD, “Bitcoin vs US Dollar”

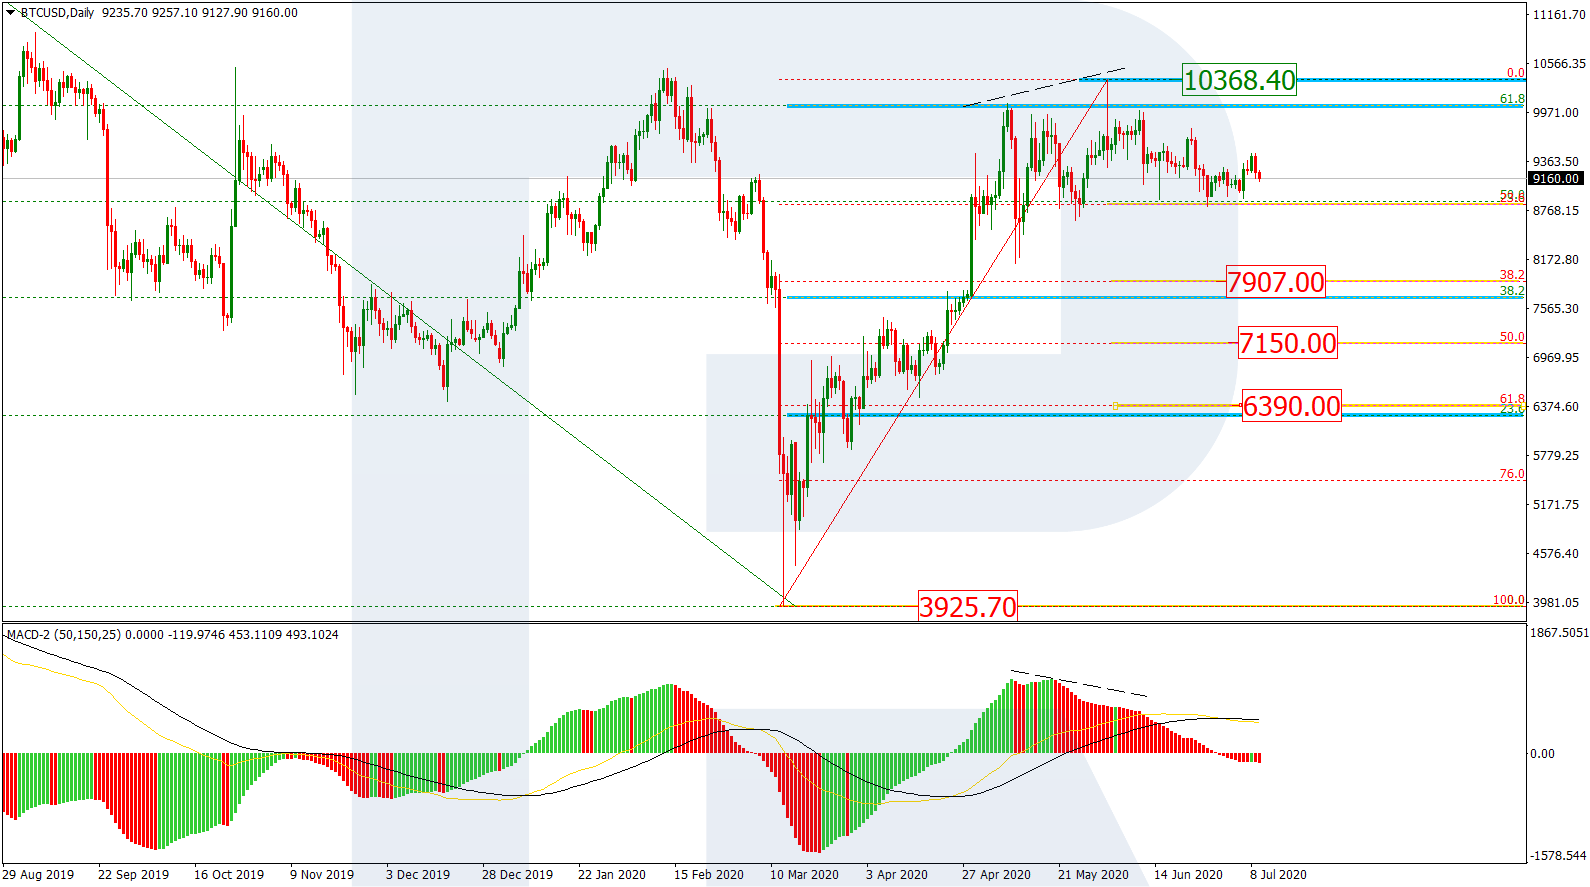
The daily chart has been showing the same technical picture for over a month. After rebounding from the 23.6% fibo, Bitcoin has failed to reach the high at 10368.450. in the nearest future, the asset is expected to re-test 23.6% fibo and then resume falling towards 38.2%, 50.0%, and 61.8% fibo at 7907.00, 7150.00, and 6390.00 respectively.

BTCUSD_D1
Risk Warning: the result of previous trading operations do not guarantee the same results in the future

As we can see in the H1 chart, after rebounding from the mid-term 23.6% fibo, the pair has corrected its previous decline by 38.2% and may continue moving towards 50.0% fibo at 9590.00. However, the decline has already reached 50.0% fibo and may continue towards 61.8% and 76.0% fibo at 9064.00 and 8927.10 respectively and then the low at 8814.20.

BTCUSD_H1
Risk Warning: the result of previous trading operations do not guarantee the same results in the future

ETHUSD, “Ethereum vs. US Dollar”

As we can see in the H4 chart, Ethereum is still moving between 23.6% fibo and the high at 214.90 and 253.47 respectively. If the price breaks the high, it may reach the fractal high at 288.98. However, if the asset breaks 23.6% fibo, it may continue trading downwards to reach 38.2% and 50.0% fibo at 191.00 and 171.60 respectively.

ETHUSD_H4
Risk Warning: the result of previous trading operations do not guarantee the same results in the future

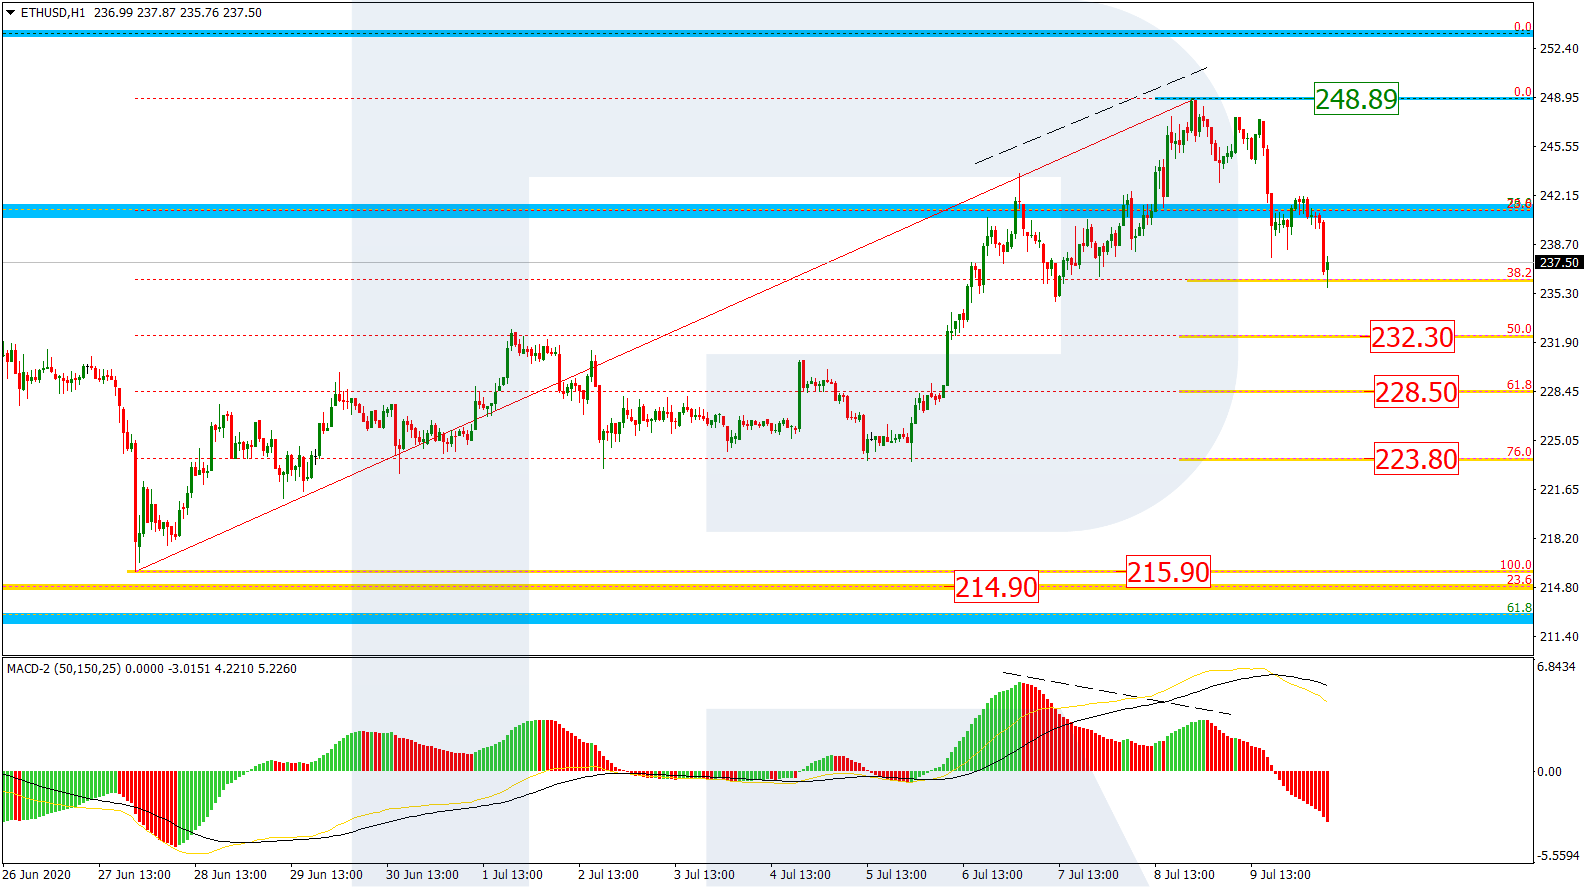
In the H1 chart, the divergence on MACD made the pair start a new descending wave, which has already reached 38.2% fibo. Later, the market may continue falling towards 50.0%, 61.8%, and 76.0% fibo at 232.30, 228.50, and 223.80 respectively and then the low at 215.90. The resistance is the high at 248.89.

ETHUSD_H1

Article By RoboForex.com

Attention!
Forecasts presented in this section only reflect the author’s private opinion and should not be considered as guidance for trading. RoboForex LP bears no responsibility for trading results based on trading recommendations described in these analytical reviews.