Author Archive for InvestMacro – Page 11

EUR/USD bulls in charge of the action – a break of 1.1500 ahead?

By Admiral Markets

Economic events

Source: Economic Events 17 July 2020 – Admiral Markets’ Forex Calendar

The Euro pushed to its highest levels against the US dollar since March, falling short of only around 50 pips short to attack its current yearly highs of 1.1495/1500. The driver for this bullish performance certainly came from the anticipation of further fiscal integration.

While Dutch Prime Minister Rutte said last Tuesday that he was pessimistic about the chances of reaching a deal at the special summit of EU leaders starting today, it nevertheless appears that EU leaders are committed to moving towards finding an agreement on a roughly 1.85 trillion Euro European Corona pandemic recovery fund.

This can also be seen in the comments from the ECB, and rhetoric from ECB president Lagarde last Thursday, were she re-formulated the monetary policy status quo after the ECB exceeded expectations at its last policy meeting by increasing the size of its pandemic emergency purchase program (PEPP) to 1.35 trillion Euro, and extending its run at least through June 2021.

That said, we expect further bullishness in the Euro, especially against the US dollar, in the coming days, with a break above 1.1450/1500 arriving sooner rather than later, levelling the path up to 1.1700/1800.

Still, this bullish outlook should be taken with a grain of salt since technically the bearish divergence in the RSI(14) on a Daily time-frame to, at least short-term, diminishing bullish momentum.

Nevertheless, as long as EUR/USD trades above 1.1150/1200, our bullish stance on the Euro against the US dollar stands:

EUR/USD daily chart

Source: Admiral Markets MT5 with MT5-SE Add-on EUR/USD Daily chart (between May 17, 2019, to July 16, 2020). Accessed: July 16, 2020, at 10:00pm GMT – Please note: Past performance is not a reliable indicator of future results, or future performance.

In 2015, the value of the EUR/USD fell by 10.2%, in 2016, it fell by 3.2%, in 2017, it increased by 13.92%, 2018, it fell by 4.4%, 2019, it fell by 2.2%, meaning that after five years, it was down by 7.3%

Discover the world’s #1 multi-asset platform

Admiral Markets offers professional traders the ability to trade with a custom, upgraded version of MetaTrader 5, allowing you to experience trading at a significantly higher, more rewarding level. Experience benefits such as the addition of the Market Heat Map, so you can compare various currency pairs to see which ones might be lucrative investments, access real-time trading data, and so much more. Click the banner below to start your FREE download of MT5 Supreme Edition!

Download MetaTrader 5 and begin trading today!

Disclaimer: The given data provides additional information regarding all analysis, estimates, prognosis, forecasts or other similar assessments or information (hereinafter “Analysis”) published on the website of Admiral Markets. Before making any investment decisions please pay close attention to the following:

  1. This is a marketing communication. The analysis is published for informative purposes only and are in no way to be construed as investment advice or recommendation. It has not been prepared in accordance with legal requirements designed to promote the independence of investment research, and that it is not subject to any prohibition on dealing ahead of the dissemination of investment research.
  2. Any investment decision is made by each client alone whereas Admiral Markets shall not be responsible for any loss or damage arising from any such decision, whether or not based on the Analysis.
  3. Each of the Analysis is prepared by an independent analyst (Jens Klatt, Professional Trader and Analyst, hereinafter “Author”) based on the Author’s personal estimations.
  4. To ensure that the interests of the clients would be protected and objectivity of the Analysis would not be damaged Admiral Markets has established relevant internal procedures for prevention and management of conflicts of interest.
  5. Whilst every reasonable effort is taken to ensure that all sources of the Analysis are reliable and that all information is presented, as much as possible, in an understandable, timely, precise and complete manner, Admiral Markets does not guarantee the accuracy or completeness of any information contained within the Analysis. The presented figures refer that refer to any past performance is not a reliable indicator of future results.
  6. The contents of the Analysis should not be construed as an express or implied promise, guarantee or implication by Admiral Markets that the client shall profit from the strategies therein or that losses in connection therewith may or shall be limited.
  7. Any kind of previous or modeled performance of financial instruments indicated within the Publication should not be construed as an express or implied promise, guarantee or implication by Admiral Markets for any future performance. The value of the financial instrument may both increase and decrease and the preservation of the asset value is not guaranteed.
  8. The projections included in the Analysis may be subject to additional fees, taxes or other charges, depending on the subject of the Publication. The price list applicable to the services provided by Admiral Markets is publicly available from the website of Admiral Markets.

Leveraged products (including contracts for difference) are speculative in nature and may result in losses or profit. Before you start trading, you should make sure that you understand all the risks.

By Admiral Markets

The Fed’s independence helped it save the US economy in 2008 – the CDC needs the same authority today

By Mitchel Y. Abolafia, University at Albany, State University of New York

The image of scientists standing beside governors, mayors or the president has become common during the pandemic. Even the most cynical politician knows this public health emergency cannot be properly addressed without relying on the scientific knowledge possessed by these experts.

Yet, ultimately, U.S. government health experts have limited power. They work at the discretion of the White House, leaving their guidance subject to the whims of politicians and them less able to take urgent action to contain the pandemic.

The Centers for Disease Control and Prevention has issued guidelines only to later revise them after the White House intervened. The administration has also undermined its top infectious disease expert, Dr. Anthony Fauci, over his blunt warnings that the pandemic is getting worse – a view that contradicts White House talking points. And most recently, the White House stripped the CDC of control of coronavirus data, alarming health experts who fear it will be politicized or withheld.

In the realm of monetary policy, however, there is an agency with experts trusted to make decisions on their own in the best interests of the U.S. economy: the Federal Reserve. As I describe in my recent book, “Stewards of the Market,” the Fed’s independence allowed it to take politically risky actions that helped rescue the economy during the financial crisis of 2008.

That’s why I believe we should give the CDC the same type of authority as the Fed so that it can effectively guide the public through health emergencies without fear of running afoul of politicians.

The paradox of expertise

There is a paradox inherent in the relationship between political leaders and technical experts in government.

Experts have the training and skill to apply scientific knowledge in complex biological and economic systems, yet democratically elected political leaders may overrule or ignore their advice for ill or good.

This happened in May when the CDC, the federal agency charged with controlling the spread of disease, removed advice regarding the dangers of singing in church choirs from its website. It did not do so because of new evidence. Rather, it was because of political pressure from the White House to water down the guidance for religious groups.
Similarly, the White House undermined the CDC’s guidance on school reopenings and has pressured it to revise them. So far, it seems the CDC has rebuffed the request.

[Expertise in your inbox. Sign up for The Conversation’s newsletter and get expert takes on today’s news, every day.]

The ability of elected leaders to ignore scientists – or the scientists’ acquiescence to policies they believe are detrimental to public welfare – is facilitated by many politicians’ penchant for confident assertion of knowledge and the scientist’s trained reluctance to do so.

Compare Fauci’s repeated comment that “there is much we don’t know about the virus” with President Donald Trump’s confident assertion that “we have it totally under control.”

Experts with independence

Given these constraints on technical expertise, the performance of the Fed in the financial crisis of 2008 offers an informative example that may be usefully applied to the CDC today.

The Federal Reserve is not an executive agency under the president, though it is chartered and overseen by Congress. It was created in 1913 to provide economic stability, and its powers have expanded to guard against both depression and crippling inflation.

At its founding, the structure of the Fed was a political compromise designed make it independent within the government in order to de-politicize its economic policy decisions. Today its decisions are made by a seven-member board of governors and a 12-member Federal Open Market Committee. The members, almost all Ph.D. economists, have had careers in academia, business and government. They come together to analyze economic data, develop a common understanding of what they believe is happening and create policy that matches their shared analysis. This group policymaking is optimal when circumstances are highly uncertain, such as in 2008 when the global financial system was melting down.

The Fed was the lead actor in preventing the system’s collapse and spent several trillion dollars buying risky financial assets and lending to foreign central banks – decisions that were pivotal in calming financial markets but would have been much harder or may not have happened at all without its independent authority.

The Fed’s independence is sufficiently ingrained in our political culture that its chair can have a running disagreement with the president yet keep his job and authority.

Putting experts at the wheel

A health crisis needs trusted experts to guide decision-making no less than an economic one does. This suggests the CDC or some re-imagined version of it should be made into an independent agency.

Like the Fed, the CDC is run by technical experts who are often among the best minds in their fields. Like the Fed, the CDC is responsible for both analysis and crisis response. Like the Fed, the domain of the CDC is prone to politicization that may interfere with rational response. And like the Fed, the CDC is responsible for decisions that affect fundamental aspects of the quality of life in the United States.

Were the CDC independent right now, we would likely see a centralized crisis management effort that relies on the best science, as opposed to the current patchwork approach that has failed to contain the outbreak nationally. We would also likely see stronger and consistent recommendations on masks, social distancing and the safest way to reopen the economy and schools.

Independence will not eliminate the paradox of technical expertise in government. The Fed itself has at times succumbed to political pressure. And Trump would likely try to undermine an independent CDC’s legitimacy if its policies conflicted with his political agenda – as he has tried to do with the central bank.

But independence provides a strong shield that would make it much more likely that when political calculations are at odds with science, science wins.The Conversation

About the Author:

Mitchel Y. Abolafia, Professor Of Public Affairs and Policy, University at Albany, State University of New York

This article is republished from The Conversation under a Creative Commons license. Read the original article.


How smugglers are shifting staggering amounts of contraband despite the pandemic

By Alexander Kupatadze, King’s College London

On July 1, Italian police made the largest amphetamine seizure in the world. At the port of Salerno, just south of Naples, they used chainsaws to open large cylinders of paper and industrial machinery that were inside shipping containers from Syria and found 14 tonnes of pills.

In Hong Kong, customs officials seized record numbers of illegal shark fins in April and May, from an estimated 38,500 sharks. Meanwhile, the trade in counterfeit drugs and medical equipment has been in overdrive. US border authorities recently confirmed that they had seized nearly a million units by the beginning of June.

These record seizures are puzzling, since they suggest that such activities are increasing. The trade in illicit and legitimate goods are usually closely connected, with traffickers and smugglers often using legitimate goods to conceal their commodities – just like in the Italian amphetamine bust. Yet the global trade in legitimate goods has declined sharply during the pandemic and is forecast to be down 10% year on year in 2020. So what is going on?

Risk and reward

To some extent, illicit traffic will be more visible to authorities because legal trade flows have shrunk and there is additional checking at national borders. The seizures are also a sign of criminals taking greater risks because they can make higher returns on scarce goods. In the UK, criminals have been smuggling drugs in bulk because it’s harder to smuggle lots of smaller shipments. Larger actors can often cope with the increased transaction costs, while petty smugglers sometimes end up getting pushed out of business.

Criminals have had to innovate to keep their supply chains open. A good example is concealing illegal drugs in consignments of face masks or other medical supplies. We are also seeing changes in the modes of transport that smugglers are using. Some activities that usually move by air or road – certain wildlife trafficking, for example – have switched to rail and maritime routes.

Shipping is more attractive because most seaports have continued to operate. In some cases, illicit trade on ships has increased. For example, the port of Antwerp in Belgium reports that cocaine shipments from Latin America have risen.

Yet there have also been drawbacks to maritime smuggling during the pandemic, including cargo congestion at seaports and reduced capacity because of coronavirus restrictions on vessels and crews. Trains, on the other hand, have been running relatively unscathed. They are also less scrutinised by officials and transporting more legal cargo than usual. Hence rail routes from China to Europe have become an attractive alternative for transporting counterfeit consumer goods, for example.

To the extent that smugglers have identified new routes and methods for moving illicit goods, or acquired new knowledge and skills, some of these techniques might well continue after the pandemic.

Sales and production

Criminals have had to learn new techniques of concealment and evasion in making and selling their contraband. There have been reports of drug dealers posing as key workers to move freely in the UK, using props like NHS badges or high-vis vests.

Before the crisis, there was already a growing problem of criminals posting small parcels of illicit goods in the mail. This seems even more popular in some places during the pandemic – mail deliveries of recreational drugs in Shanghai have risen, for instance.

Online trading has long been the main platform for illicit goods, and this too has grown in 2020. At least 100,000 new websites have emerged since March selling COVID-related substandard or fake medical items. There are also signs of more counterfeit consumer goods selling online, including fake car parts and accessories. Demand for counterfeits is likely to keep rising as the economy worsens, and because some legitimate goods are more scarce than usual.

Manufacturing of illicit products was temporarily disrupted early in the pandemic. Chinese criminals couldn’t make counterfeit luxuries, for example, or export the usual chemical supplies for making fentanyl, but they were back to business as usual within a few weeks.

Illicit manufacturing did not change as dramatically as other aspects of the trade, partially because it is less flexible. The average producer of counterfeit handbags cannot quickly re-focus on making fake pharmaceuticals. In contrast, a new route for transporting illegal goods can move everything from drugs to wildlife to counterfeit luxuries.

What next

Counterfeiting and smuggling have been made easier by the more dispersed supply chains in our globalised world. Yet these networks are likely to shrink after the pandemic as multinationals bring some manufacturing nearer home to be less vulnerable to the kind of trade restrictions seen in 2020. Indeed, this “reshoring” started before COVID-19, and could make smuggling and counterfeiting more difficult.

Shorter and simpler supply chains for legitimate goods will most affect illicit products that are smuggled on the back of them. This would include not only things like drugs concealed in shipping containers but also counterfeit consumer goods “sneaked” into authentic consignments of the same product and sold as the real thing. On the other hand, counterfeits that can be distinguished from the brand-name product usually rely on an independent supply chain.

Deglobalisation is bad news for China-based criminals, since they produce most of the world’s counterfeits. They will certainly have to adapt to some companies relocating and diversifying their supply chains and doing more due diligence about their suppliers.

Yet it is difficult to guarantee the ethical standards of your business partners even with greater due diligence, particularly if the economic fallout of the pandemic reduces the alternatives. There are also indications that for practical reasons, China’s status as the workshop of the world is unlikely to change dramatically. And even if shorter supply chains make a big difference to the illicit trade, it may just motivate criminals to come up with new ways to meet demand. It may just displace illicit supply chains to places such as Turkey, Thailand and India.The Conversation

About the Author:

Alexander Kupatadze, Lecturer in Transnational Crime, King’s College London

This article is republished from The Conversation under a Creative Commons license. Read the original article.


Ichimoku Cloud Analysis 16.07.2020 (USDJPY, USDCAD, NZDUSD)

Article By RoboForex.com

USDJPY, “US Dollar vs Japanese Yen”

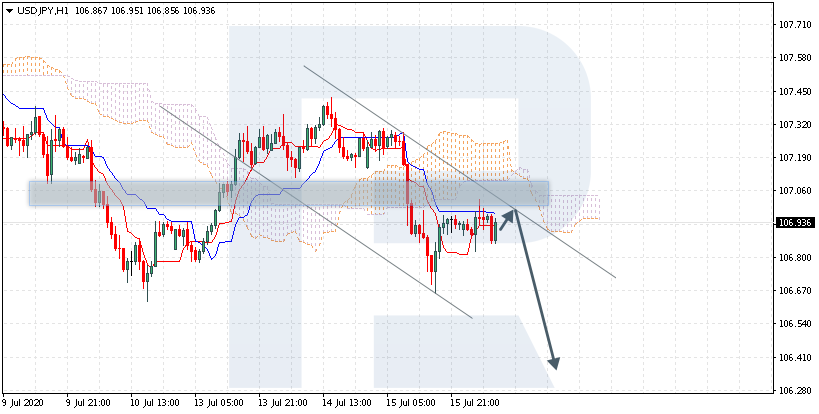
USDJPY is trading at 106.93; the instrument is moving below Ichimoku Cloud, thus indicating a descending tendency. The markets could indicate that the price may test Tenkan-Sen and Kijun-Sen at 107.05 and then resume moving downwards to reach 106.30. Another signal is favor of further downtrend will be a rebound from the descending channel’s upside border. However, the bearish scenario may no longer be valid if the price breaks the cloud’s upside border and fixes above 107.20. In this case, the pair may continue growing towards 108.05.

USDJPY
Risk Warning: the result of previous trading operations do not guarantee the same results in the future

USDCAD, “US Dollar vs Canadian Dollar”

USDCAD is trading at 1.3507; the instrument is moving below Ichimoku Cloud, thus indicating a descending tendency. The markets could indicate that the price may test Tenkan-Sen and Kijun-Sen at 1.3540 and then resume moving downwards to reach 1.3425. Another signal in favor of further downtrend will be a rebound from the descending channel’s upside border. However, the bearish scenario may no longer be valid if the price breaks the cloud’s upside border and fixes above 1.3585. In this case, the pair may continue growing towards 1.3675.

USDCAD
Risk Warning: the result of previous trading operations do not guarantee the same results in the future

NZDUSD, “New Zealand Dollar vs US Dollar”

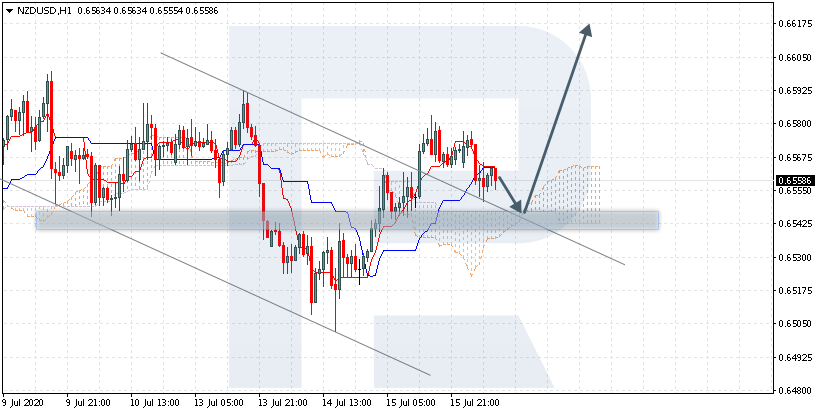
NZDUSD is trading at 0.6558; the instrument is moving above Ichimoku Cloud, thus indicating an ascending tendency. The markets could indicate that the price may test the cloud’s upside border at 0.6545 and then resume moving upwards to reach 0.6620. Another signal in favor of further uptrend will be a rebound from the descending channel’s upside border. However, the bullish scenario may be canceled if the price breaks the cloud’s downside border and fixes below 0.6525. In this case, the pair may continue falling towards 0.6440.

NZDUSD

Article By RoboForex.com

Attention!
Forecasts presented in this section only reflect the author’s private opinion and should not be considered as guidance for trading. RoboForex LP bears no responsibility for trading results based on trading recommendations described in these analytical reviews.

Japanese Candlesticks Analysis 16.07.2020 (USDCAD, AUDUSD, USDCHF)

Article By RoboForex.com

USDCAD, “US Dollar vs Canadian Dollar”

As we can see in the H4 chart, USDCAD is testing the support level once again. By now, the price has formed several reversal patterns, such as Doji. Considering the current downtrend, one may assume that the asset may finish the correction and then continue falling. In this case, the downside target is at 1.3434. Still, an opposite scenario suggests that the instrument may continue growing to return to the resistance area at 1.3685.

USDCAD
Risk Warning: the result of previous trading operations do not guarantee the same results in the future

AUDUSD, “Australian Dollar vs US Dollar”

As we can see in the H4 chart, the uptrend continues. By now, AUDUSD has formed an Engulfing pattern not far from the resistance area; at the moment, the pair is reversing. The downside target is the closest support level at 0.6970. Later, the price may rebound from the channel’s downside border and continue the rising tendency. In this case, the upside target remains at 0.7070. At the same time, one shouldn’t exclude another scenario, which implies that the instrument may continue falling and return to 0.6900.

AUDUSD
Risk Warning: the result of previous trading operations do not guarantee the same results in the future

USDCHF, “US Dollar vs Swiss Franc”

As we can see in the H4 chart, after testing the support area and forming a Hammer pattern, USDCHF is reversing. The correctional target is the channel’s upside border. After completing the pullback, the pair may resume trading downwards to reach the next target at 0.9360. Later, the market may update its highs and continue falling.

USDCHF

Article By RoboForex.com

Attention!
Forecasts presented in this section only reflect the author’s private opinion and should not be considered as guidance for trading. RoboForex LP bears no responsibility for trading results based on trading recommendations described in these analytical reviews.

The Analytical Overview of the Main Currency Pairs on 2020.07.16

by JustForex

The EUR/USD currency pair

Technical indicators of the currency pair:
  • Prev Open: 1.13976
  • Open: 1.14096
  • % chg. over the last day: +0.12
  • Day’s range: 1.13928 – 1.14186
  • 52 wk range: 1.0777  – 1.1494

The EUR/USD currency pair has become stable after a prolonged rally. At the moment, the trading instrument is consolidating near the round level of 1.1400. Investors have taken a wait-and-see attitude before today’s ECB meeting. It is expected that the regulator will keep the key marks of monetary policy at the same level. We also recommend paying attention to economic releases from the US. Positions should be opened from key levels.

The news feed on 2020.07.16:
  • – ECB interest rate decision at 14:45 (GMT+3:00);
  • – Report on retail sales in the US at 15:30 (GMT+3:00);
  • – Initial jobless claims in the US at 15:30 (GMT+3:00);
  • – Philadelphia Fed manufacturing index at 15:30 (GMT+3:00).
EUR/USD

Indicators do not give accurate signals: the price has crossed the 50 MA.

The MACD histogram is near the 0 mark.

Stochastic Oscillator is in the neutral zone, the %K line is above the %D line, which indicates the bullish sentiment.

Trading recommendations
  • Support levels: 1.1385, 1.1365, 1.1325
  • Resistance levels: 1.1420, 1.1450

If the price fixes above 1.1420, further growth in EUR/USD quotes is expected. The movement is tending to the round level of 1.1500.

An alternative could be a decline in the EUR/USD currency pair to 1.1350-1.1320.

The GBP/USD currency pair

Technical indicators of the currency pair:
  • Prev Open: 1.25468
  • Open: 1.25731
  • % chg. over the last day: +0.24
  • Day’s range: 1.25266 – 1.25938
  • 52 wk range: 1.1466  – 1.3516

GBP/USD quotes have been declining. The British pound has updated local lows. At the moment, the GBP/USD currency pair is consolidating. The key range is 1.2520-1.2565. The technical pattern signals a further fall in the trading instrument. We expect important economic reports from the US. Positions should be opened from key levels.

The UK has published rather optimistic data on the labor market.

GBP/USD

Indicators signal the power of sellers: the price has fixed below 50 MA and 100 MA.

The MACD histogram has moved into the negative zone, indicating the bearish sentiment.

Stochastic Oscillator is in the neutral zone, the %K line has crossed the %D line. There are no signals at the moment.

Trading recommendations
  • Support levels: 1.2520, 1.2480, 1.2460
  • Resistance levels: 1.2565, 1.2590, 1.2640

If the price fixes below 1.2520, a further drop in the GBP/USD quotes is expected. The movement is tending to 1.2480-1.2460.

An alternative could be the growth of the GBP/USD currency pair to 1.2590-1.2620.

The USD/CAD currency pair

Technical indicators of the currency pair:
  • Prev Open: 1.36085
  • Open: 1.35095
  • % chg. over the last day: -0.77
  • Day’s range: 1.35013 – 1.35276
  • 52 wk range: 1.2949  – 1.4668

Yesterday, aggressive sales were observed on the USD/CAD currency pair. The loonie has added more than 100 points in price against the greenback. The Bank of Canada, as expected, kept the key marks of monetary policy at the same level. The regulator does not plan to adjust interest rates for a long period of time. At the moment, USD/CAD quotes have become stable. The trading instrument is consolidating in the range of 1.3500-1.3540. We recommend opening positions from these marks.

The news feed on Canada’s economy is calm.

USD/CAD

Indicators signal the power of sellers: the price has fixed below 50 MA and 100 MA.

The MACD histogram is in the negative zone, but above the signal line, which gives a weak signal to sell USD/CAD.

Stochastic Oscillator is in the neutral zone, the %K line is above the %D line, which indicates a possible correction of the USD/CAD currency pair.

Trading recommendations
  • Support levels: 1.3500, 1.3450
  • Resistance levels: 1.3540, 1.3560, 1.3585

If the price fixes above 1.3540, USD/CAD quotes are expected to correct. The movement is tending to 1.3560-1.3580.

An alternative may be a decline in the USD/CAD currency pair to 1.3470-1.3450.

The USD/JPY currency pair

Technical indicators of the currency pair:
  • Prev Open: 107.182
  • Open: 106.930
  • % chg. over the last day: -0.28
  • Day’s range: 106.986 – 107.077
  • 52 wk range: 101.19  – 112.41

The technical pattern on the USD/JPY currency pair is ambiguous. The trading instrument is consolidating. Local support and resistance levels are 106.85 and 107.10, respectively. Investors expect additional drivers. We recommend paying attention to economic reports, as well as to the dynamics of the US government bonds yield. Positions should be opened from key levels.

The news feed on Japan’s economy is calm.

USD/JPY

Indicators do not give accurate signals: the price has crossed the 50 MA and 100 MA.

The MACD histogram is near the 0 mark.

Stochastic Oscillator is in the neutral zone, the %K line is above the %D line, which indicates the bullish sentiment.

Trading recommendations
  • Support levels: 106.85, 106.65
  • Resistance levels: 107.10, 107.30, 107.40

If the price fixes below 106.85, a further drop in USD/JPY quotes is expected. The movement is tending to 106.65-106.50.

An alternative could be the growth of the USD/JPY currency pair to 107.30-107.50.

by JustForex

Horizen Announces the Beta Release of Zendoo – The Industry’s First Decentralized and Fully Customizable Sidechain Solution

New York, NY – July 15, 2020 – Horizen (ZEN) announced today the first completely decentralized and fully customizable sidechain protocol on the market, The Horizen sidechain platform, Zendoo, enables businesses and developers to affordably create private or public blockchains mapped onto the Horizen public mainchain with the largest node network in the industry.

Seeking to solve scalability and flexibility issues in blockchain, Horizen has built a general-purpose blockchain platform that enables a sidechain ecosystem for real-world use cases.

Zendoo addresses all user needs through a unique framework that allows any rule type to be deployed as a sidechain – whether it’s a blockchain or other types of computing systems. The release coincides with the release of their Beta Software Development Kit (SDK) which provides application developers with a suite of tools to deploy both public and private blockchains with minimal technical barriers and unlimited design paths.

“We see blockchain technology as a crucial step towards the future, but until now there hasn’t been a product that truly enabled businesses and developer community to fully harness that power effectively.” Stated Robert Viglione, Co-founder of Horizen. “Horizen’s sidechain solution breaks down the barriers that make it difficult for the world to begin utilizing blockchain technology in a way that doesn’t slow down the network or limit the users to specific application models.”

“The Horizen team is committed to building a more inclusive future for society by providing tools that empower our users. This type of distributed, user-owned network offers a new way of bringing people together, creating and sharing value, and giving voice to everyone by participating in a common ecosystem built on a shared public infrastructure,” added Viglione.

Zendoo is built on the Horizen’s mainchain infrastructure which is supported by its multi-tiered node network, the largest node network in the industry. The setup provides user-owned sidechain systems benefits from a large public blockchain such as security and decentralization without inheriting their limitations such as limited throughput and increased latency.

Horizen maintains its focus on privacy in its sidechain solution design through the usage of the leading privacy technology, zk-SNARKs, for enabling verifiable cross-chain communications. This approach allows users to create auditable and data privacy-preserving applications to address real-world use cases. Horizen released a new zk-SNARKs library in March to support its privacy-focused features.

“The release of the Zendoo sidechain platform reveals one of the very few truly decentralized scalability solutions: unfederated, 2-way pegged sidechains based on decoupled consensus. Zendoo features an entire constellation of qualities that will delight most discerning blockchain developers.” stated Uri Stav, Chief Security and Development Officer of Genesis, a leading digital asset trading and lending firm.

“The Zendoo sidechain ecosystem enables developers to flexibly implement a wide diversity of use cases and real-world systems: no more need to fight and argue about block size, or about a store of value vs useful functionality. The freedom to create is that of a developer,” added Stav

About Horizen 

Horizen’s mission is to empower people and bring the world together by building a fair and inclusive ecosystem where everyone is rewarded for their contributions.

Horizen’s sidechain and scaling solution, Zendoo, is the first completely decentralized and fully customizable sidechain protocol on the market. The Horizen sidechain platform enables businesses and developers to affordably and quickly create real-world blockchain applications on Horizen’s fully distributed, secure, and privacy-preserving architecture supported by the largest node system in the industry. Horizen’s Sidechain SDK provides all necessary components for the easy and fast deployment of a fully customizable blockchain.


Cutting taxes for the wealthy is the worst possible response to this economic crisis

By John Quiggin, The University of Queensland

Australia’s response to the health and economic impacts of the COVID-19 pandemic is rightly considered one of the world’s best. At their best, our federal and state politicians have put aside the sterile games dominating politics for decades.

It seemed possible these efforts might last, as politicians sought to find common ground and make real progress on issues such as climate change, industrial relations and inequality as part of the coronavirus recovery.

But as soon as the virus seemed to be receding, politics returned to the old “normal”. Policies are again being put forward on the basis of ideological reflexes rather than an analysis of the required response to our new situation.

There is no more striking example than the federal government’s reported plan to bring forward income tax cuts legislated for 2024-25. The idea apparently has backbench support.

Those cuts will benefit high-income earners the most. They include replacing the 32.5% marginal tax rate on incomes between A$45,000 and A$120,000, and the 37% rate on incomes between AA$180,000, with a single 30% rate up to A$200,000.

This is being proposed while the government begins to wind back income-support measures, such as free child care, with much more serious “cliffs” fast approaching.

This economic crisis is different

One of the most striking features of Australia’s initial response to COVID-19 was the speed at which the Morrison government abandoned a decade of rhetoric denouncing the Rudd Labor government’s response to the Global Financial Crisis.

In mid-March the government was floating the idea of a tightly limited response with a budget of A$5 billion. By the end of the month this had been abandoned in favour of the JobSeeker and JobKeeper schemes, estimated to cost A$14 billion and A$70 billion respectively. Other schemes brought the total to A$133 billion.

Despite the close resemblance to the Rudd stimulus packages, there was one crucial difference.

The GFC caused a collapse in the availability of credit, potentially choking off consumer demand and private investment. This was the classic case needing demand stimulus.

By contrast, the COVID-19 pandemic caused a shock to the production side of the economy, which flowed through to incomes. Millions of workers in industries such as tourism, hospitality and the arts were no longer able to work because of the virus.

The crucial problem was to support the incomes of those thrown out of work, and keep the businesses employing them afloat until some kind of normality returned. There were problems with the details of eligibility and implementation of the JobSeeker and JobKeeper programs, but the response was essentially right.

Have cash, will buy luxury car

The primary rationale for early tax cuts is that they will stimulate demand. But the economy’s real problem is not inadequate demand – particularly not on the part of high-income earners.

On the contrary, the problem for high-income earners is having a steady income even as many of the things they usually spend on (high-end restaurant meals, interstate and overseas holidays) have become unobtainable.

Among the results has been a splurge on luxury cars. Compared to June 2019, sales of Mazdas, Hyundais, Mitsubishis, Kias, Nissans and Hondas last month were all down. But Mercedes-Benz, BMW, Audi and Lexus were all up.

As Jason Murphy notes, this rush to buy fancy cars isn’t definitive proof the wealthy are looking to ways to spend all the money they’re saving. “But it is suggestive. Eventually the money has to go somewhere.”

The worst possible course of action

The continuing problem with the pandemic is the loss of income faced by millions of workers. By definition, anyone in a position to benefit from a high-end tax cut doesn’t have this problem. Equity would suggest that, far from receiving more income, they should be sharing more of the burden, if not now then in the recovery period.

When the federal government legislated its tax-cut schedule in advance, critics including Reserve Bank governor Philip Lowe and Access Economics partner Chris Richardson pointed out the danger of promising future tax cuts based on projected growth. The same policy had failed ignominiously in the 1990s when the Keating government legislated tax cuts to be introduced after the 1993 election. After declaring the cuts “L-A-W”, Paul Keating was forced to withdraw half of the tax cuts when the budget deteriorated.

These criticisms have now been vindicated.

The decade of strong economic growth, starting this year, that was supposed to make big tax cuts affordable has disappeared. We will be lucky if per capita GDP is back to its 2019 levels by 2024-25, when the tax cuts are slated to kick in regardless of circumstances.

Once that happens, we will need all the tax revenue we can get to bring the budget back into balance and deal with the continuing expenditure needs the pandemic has created.

The government now seems to be headed for the worst possible course of action – cutting support for those hit hardest by the pandemic while pouring money into the bank accounts of the well-off.

The inevitable result of such a policy will be a surge of personal and business bankruptcies, mortgage defaults and evictions. That will bring about the kind of demand-deficiency recession the tax cuts are supposed to prevent, superimposed on the continuing constraints created by the pandemic.

So far we have all been in this together. For high-income earners that means forgoing tax cuts promised in happier times and contributing more to the relief of those who need it most.The Conversation

About the Author:

John Quiggin, Professor, School of Economics, The University of Queensland

This article is republished from The Conversation under a Creative Commons license. Read the original article.

Forex Technical Analysis & Forecast 15.07.2020

Article By RoboForex.com

EURUSD, “Euro vs US Dollar”

EURUSD has extended the wave up to 1.1420. Possibly, today the pair may form a new descending structure towards 1.1373 and then start another growth to reach 1.1390, thus forming a new consolidating range between these two levels. If later the price breaks this range to the downside, the market may resume trading downwards with the target at 1.1330.

EURUSD
Risk Warning: the result of previous trading operations do not guarantee the same results in the future

GBPUSD, “Great Britain Pound vs US Dollar”

After finishing the descending wave at 1.2480, GBPUSD is correcting upwards with the target at 1.2588. Later, the market may start a new decline to reach the short-term target at 1.2454.

GBPUSD
Risk Warning: the result of previous trading operations do not guarantee the same results in the future

USDRUB, “US Dollar vs Russian Ruble”

USDRUB is consolidating below 71.23. Today, the pair may fall to break 70.55 and then continue trading downwards with the target at 69.90. Later, the market may start a new correction to reach 71.27.

USDRUB
Risk Warning: the result of previous trading operations do not guarantee the same results in the future

USDJPY, “US Dollar vs Japanese Yen”

USDJPY is still consolidating around 107.20. Possibly, today the pair may form a new descending structure to return to 107.00 and then start another growth to reach 107.50. Later, the market may resume falling towards 106.94 or even deeper, 106.60.

USDJPY
Risk Warning: the result of previous trading operations do not guarantee the same results in the future

USDCHF, “US Dollar vs Swiss Franc”

USDCHF is still consolidating around 0.9400. If later the price breaks this range to the upside at 0.9415, the market may resume trading upwards with the target at 0.9440 or even higher, 0.9550; if to the downside at 0.9388 – form a new descending structure with the target at 0.9366.

USDCHF
Risk Warning: the result of previous trading operations do not guarantee the same results in the future

AUDUSD, “Australian Dollar vs US Dollar”

After completing the ascending wave at 0.7017, AUDUSD is expected to fall towards 0.6967 and then grow to reach 0.6991, thus forming a new consolidating range between these two levels. If later the price breaks this range to the downside, the market may resume trading downwards with the target at 0.6924.

AUDUSD
Risk Warning: the result of previous trading operations do not guarantee the same results in the future

BRENT

Brent is moving not far from the upside border of the range. Possibly, the pair may break 43.30 and then continue moving upwards with the target at 45.00. After that, the instrument may start a new decline to return to 43.30 and then form one more ascending structure to reach 45.55.

BRENT
Risk Warning: the result of previous trading operations do not guarantee the same results in the future

XAUUSD, “Gold vs US Dollar”

After completing the ascending structure at 1805.00, Gold is consolidating around this level. If later the price breaks this range to the downside, the market may resume trading downwards to reach 1791.33 or even 1777.17; if to the upside – form one more ascending structure with the target at 1819.55.

GOLD
Risk Warning: the result of previous trading operations do not guarantee the same results in the future

BTCUSD, “Bitcoin vs US Dollar”

After finishing the correction at 9260.00 and testing it from below, BTCUSD is expected to fall to break 9160.00. After that, the instrument may resume trading inside the downtrend with the target at 9000.00 or even 8700.00.

BITCOIN
Risk Warning: the result of previous trading operations do not guarantee the same results in the future

S&P 500

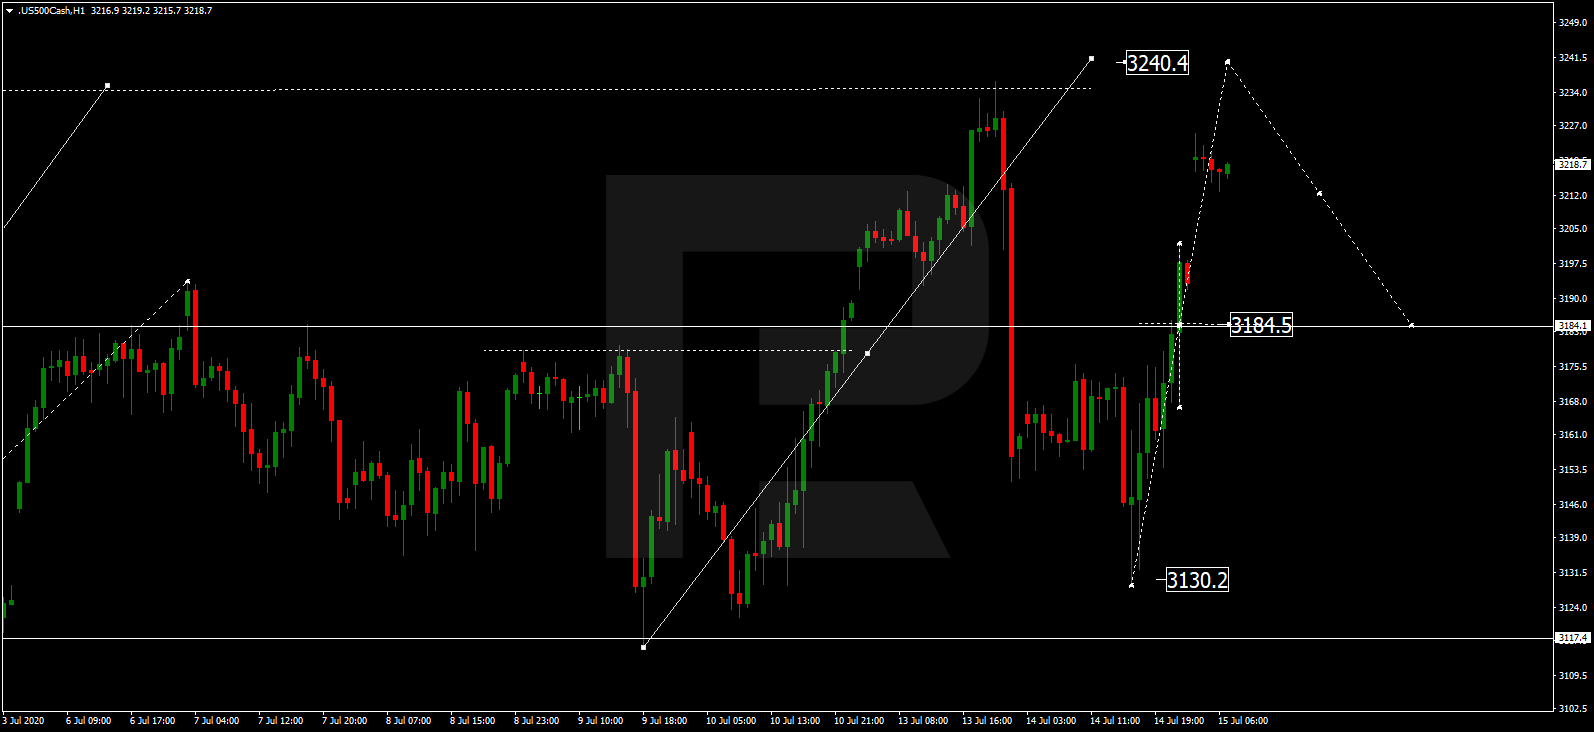
After the ascending structure towards 3185.0 and a gap up this morning, the S&P 500 Index is expected to reach 3240.4 and then fall to return to 3185.0, thus forming a new consolidating range between these two levels. If later the price breaks this range to the downside, the market may start a new correction with the target at 3111.1; if to the upside – form one more ascending structure towards 3300.3.

S&P 500

Article By RoboForex.com

Attention!
Forecasts presented in this section only reflect the author’s private opinion and should not be considered as guidance for trading. RoboForex LP bears no responsibility for trading results based on trading recommendations described in these analytical reviews.

Fibonacci Retracements Analysis 15.07.2020 (GBPUSD, EURJPY)

Article By RoboForex.com

GBPUSD, “Great Britain Pound vs US Dollar”

As we can see in the H4 chart, after finishing the ascending wave very close to 76.0% fibo at 1.2678, GBPUSD has started a new pullback. If the pair is able to resume growing and break the high at 1.2813 in the nearest future, the price may continue growing towards 50.0% and 61.8% fibo at 1.2895 and 1.3242 respectively. However, one shouldn’t exclude that the instrument may fall with the targets at the low and 50.0% fibo at 1.2252 and 1.2111 respectively.

GBPUSD_H4
Risk Warning: the result of previous trading operations do not guarantee the same results in the future

The H1 chart shows a more detailed structure of the correction after the divergence. By now, the pair has already broken 38.2% fibo but failed to reach 50.0% fibo at 1.2461. Later, it may continue falling towards the latter level, as well as 61.8% fibo at 1.2412. After completing the correction, the instrument may resume trading upwards to reach the high at 1.2670.

GBPUSD_H1
Risk Warning: the result of previous trading operations do not guarantee the same results in the future

EURJPY, “Euro vs. Japanese Yen”

As we can see in the H4 chart, after reaching 50.0% fibo, EURJPY decided not to fall towards the low at 119.31 but chose to continue growing and reach 61.8% instead, thus transforming the current correctional structure into a proper ascending wave. The next upside target is 76.0% fibo at 123.20, while the key target is the high at 124.43.

EURJPY_H4
Risk Warning: the result of previous trading operations do not guarantee the same results in the future

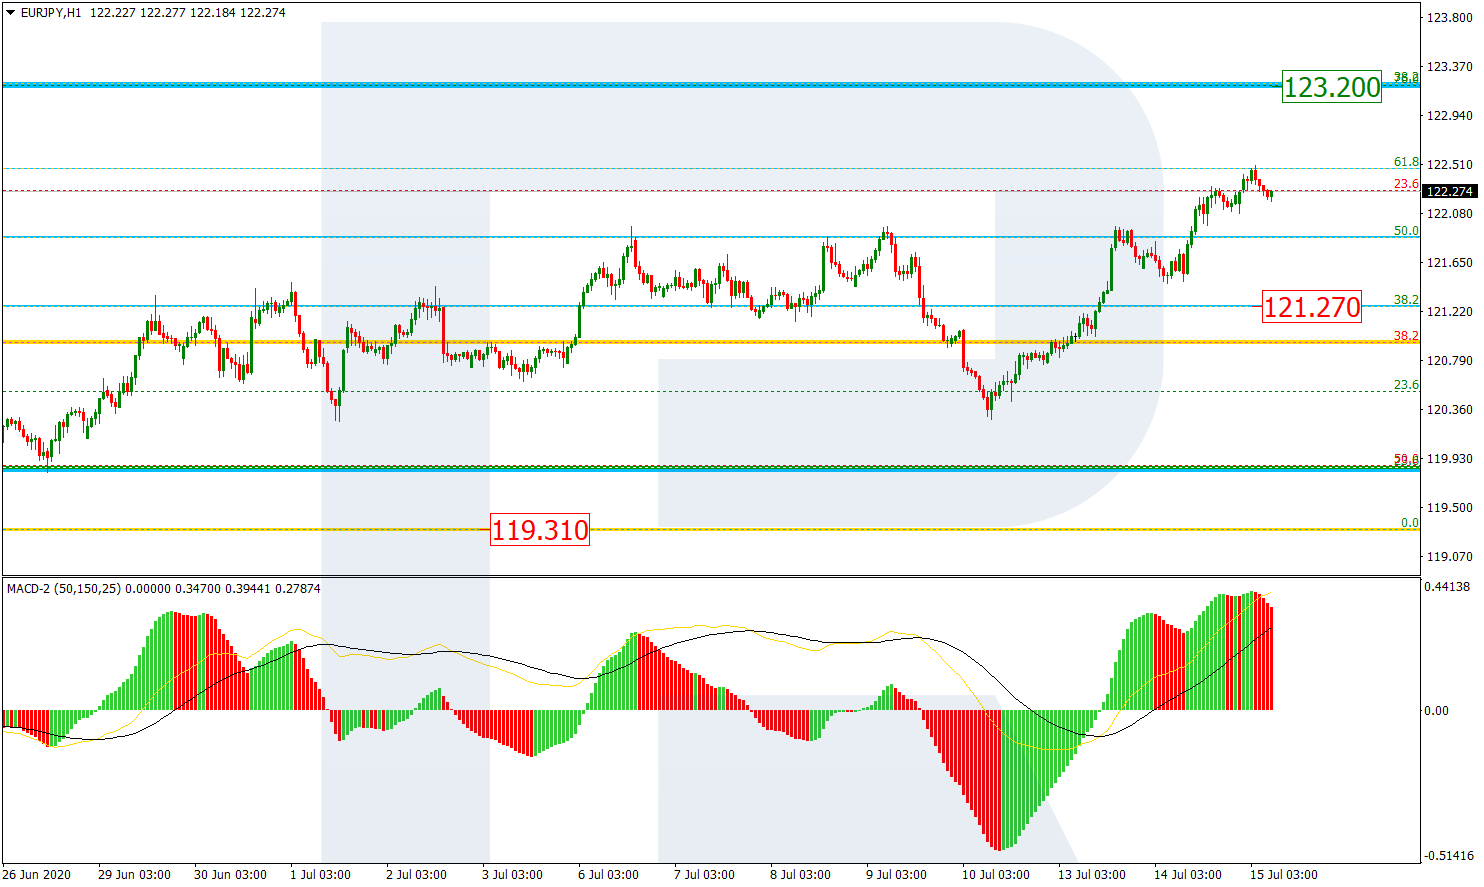
In the H1 chart, the instrument is trading upwards and has already reached 61.8% fibo. The uptrend is looking quite stable but there is a possibility of a pullback towards the support at 121.27.

EURJPY_H1

Article By RoboForex.com

Attention!
Forecasts presented in this section only reflect the author’s private opinion and should not be considered as guidance for trading. RoboForex LP bears no responsibility for trading results based on trading recommendations described in these analytical reviews.