Author Archive for InvestMacro – Page 10

The Analytical Overview of the Main Currency Pairs on 2020.07.20

by JustForex

The EUR/USD currency pair

Technical indicators of the currency pair:
  • Prev Open: 1.13833
  • Open: 1.14102
  • % chg. over the last day: +0.13
  • Day’s range: 1.14075 – 1.14678
  • 52 wk range: 1.0777  – 1.1494

The bullish sentiment continues to prevail on the EUR/USD currency pair. The trading instrument has updated its local highs again. The euro found resistance at 1.1470. The 1.1435 mark is already a “mirror” support. Financial markets are still under pressure due to the rapid increase in the number of people infected with coronavirus. At the moment, investors are focused on the EU summit in Brussels, where the leaders of the countries discuss the bloc’s budget for 2021-2027. We recommend opening positions from key levels.

EUR/USD

Indicators signal the power of buyers: the price has fixed above 50 MA and 100 MA.

The MACD histogram is in the negative zone, which indicates the bullish sentiment.

Stochastic Oscillator is located near the overbought zone, the %K line has crossed the %D line. There are no signals at the moment.

Trading recommendations
  • Support levels: 1.1435, 1.1410, 1.1370
  • Resistance levels: 1.1470, 1.1500

If the price fixes above 1.1470, further growth in EUR/USD quotes is expected. The movement is tending to 1.1500-1.1520.

An alternative could be a decrease in the EUR/USD currency pair to 1.1400-1.1370.

The GBP/USD currency pair

Technical indicators of the currency pair:
  • Prev Open: 1.25519
  • Open: 1.25530
  • % chg. over the last day: +0.01
  • Day’s range: 1.25181 – 1.25943
  • 52 wk range: 1.1466  – 1.3516

The technical pattern on the GBP/USD currency pair is still ambiguous. The British pound is being traded in a flat. Investors expect additional drivers. At the moment, the local support and resistance levels are 1.2570 and 1.2600, respectively. The trading instrument is tending to decline. Positions should be opened from key levels.

The news feed on the UK economy is calm.

GBP/USD

The indicators do not give accurate signals: the price has crossed the 50 MA and 100 MA.

The MACD histogram is near the 0 mark. There are no signals at the moment.

Stochastic Oscillator is in the overbought zone, the %K line is above the %D line, which gives a weak signal to buy GBP/USD.

Trading recommendations
  • Support levels: 1.2570, 1.2520, 1.2485
  • Resistance levels: 1.2600, 1.2625, 1.2665

If the price fixes below 1.2570, GBP/USD quotes are expected to fall. The movement is tending to 1.2530-1.2500.

An alternative could be the growth of the GBP/USD currency pair to 1.2625-1.2660.

The USD/CAD currency pair

Technical indicators of the currency pair:
  • Prev Open: 1.35659
  • Open: 1.35690
  • % chg. over the last day: +0.02
  • Day’s range: 1.35645 – 1.35999
  • 52 wk range: 1.2949  – 1.4668

USD/CAD quotes are consolidating. There is no defined trend. The loonie is testing the following key support and resistance levels: 1.3560 and 1.3600, respectively. Financial market participants expect additional drivers. We recommend paying attention to the dynamics of “black gold” prices. Positions should be opened from key levels.

The news feed on Canada’s economy is calm.

USD/CAD

Indicators do not give accurate signals: the price has crossed the 50 MA and 100 MA.

The MACD histogram is near the 0 mark.

Stochastic Oscillator is in the neutral zone, the %K line is below the %D line, which gives a signal to sell USD/CAD.

Trading recommendations
  • Support levels: 1.3560, 1.3540, 1.3520
  • Resistance levels: 1.3600, 1.3625, 1.3645

If the price fixes above 1.3600, further growth in USD/CAD quotes is expected. The movement is tending to 1.3625-1.3645.

An alternative could be a decrease in the USD/CAD currency pair to 1.3530-1.3500.

The USD/JPY currency pair

Technical indicators of the currency pair:
  • Prev Open: 107.214
  • Open: 107.092
  • % chg. over the last day: -0.25
  • Day’s range: 107.013 – 107.543
  • 52 wk range: 101.19  – 112.41

There are high trading activity and volatility on the USD/JPY currency pair. At the moment, the trading instrument is being consolidated. Local support and resistance levels are 107.10 and 107.30, respectively. USD/JPY quotes have the potential for further growth. Investors expect additional drivers. We recommend paying attention to the dynamics of the US government bonds yield. Positions should be opened from key levels.

Japan has published weak data on the trade balance for June.

USD/JPY

Indicators do not give accurate signals: the price has crossed the 50 MA and 100 MA.

The MACD histogram is in the positive zone, which gives a signal to buy USD/JPY.

Stochastic Oscillator is in the oversold zone, the %K line has crossed the %D line. There are no signals at the moment.

Trading recommendations
  • Support levels: 107.10, 106.95, 106.80
  • Resistance levels: 107.30, 107.40, 107.60

If the price fixes below 107.10, USD/JPY quotes are expected to fall. The movement is tending to 106.80-106.60.

An alternative could be the growth of the USD/JPY currency pair to 107.50-107.70.

by JustForex

Fibonacci Retracements Analysis 20.07.2020 (GOLD, USDCHF)

Article By RoboForex.com

XAUUSD, “Gold vs US Dollar”

As we can see in the H4 chart, XAUUSD is forming a slight local correction inside the post-correctional extension area between 138.2% and 161.8% fibo at 1800.60 and 1823.00 respectively. After breaking this area to the upside, the instrument may try to attack its all-time high at 1920.66. The key support is at 1670.60.

GOLD_H4
Risk Warning: the result of previous trading operations do not guarantee the same results in the future

In the H1 chart, the descending correction has reached 38.2% fibo. At the moment, the pair is moving towards the high at 1817.89 and may continue the uptrend after breaking it. At the same time, the instrument may yet start a new decline to reach 50.0% and 61.8% fibo at 1787.50 and 1780.45 respectively.

GOLD_H1
Risk Warning: the result of previous trading operations do not guarantee the same results in the future

USDCHF, “US Dollar vs Swiss Franc”

As we can see in the H4 chart, after breaking its previous low and finishing a short-term pullback, USDCHF continues falling towards the mid-term 76.0% at 0.9350. The key downside target remains the low at 0.9176. The resistance is at 0.9580.

USDCHF_H4
Risk Warning: the result of previous trading operations do not guarantee the same results in the future

In the H1 chart, after testing the low, the pair has correcting towards 61.8% fibo. At the moment, the price is forming a new descending impulse. The key short-term downside targets are inside the local post-correctional extension area between 138.2% and 161.8% fibo at 0.9309 and 0.9267 respectively.

USDCHF_H1

Article By RoboForex.com

Attention!
Forecasts presented in this section only reflect the author’s private opinion and should not be considered as guidance for trading. RoboForex LP bears no responsibility for trading results based on trading recommendations described in these analytical reviews.

Euro Is Going for The Best

By Dmitriy Gurkovskiy, Chief Analyst at RoboForex

On Monday, July 20th, the major currency pair is rising and trading at 1.1443, which is very close to the March high at 1.1496. at the moment, it’s a quite reachable target for investors, who believe only in good and expect positive decisions from the European Union after the summit.

The EU summit, which was originally scheduled for two days, Saturday and Sunday, will continue on Monday as well. The European leaders couldn’t agree on the parameters of the stability fund, which is strongly required by many countries that suffered from the coronavirus pandemic. Apart from that, there are nuances in a multi-year financial plan, which should be a basis for the budgets of some particular European countries and the EU itself for 2021-2027.

There are no doubts that the alliance needs tools and mechanisms to support its economy. The question is at whose expense the fund is going to accumulate money, who will control expenditures and choose where to spend money first.

Even with all things considered, market players are looking pretty confident that the outcome will be positive. This is the reason why the demand for the Euro isn’t decreasing.

In the H4 chart, after breaking 1.1430 to the upside, EUR/USD is expected to continue growing towards 1.1480. After that, the instrument may correct to reach 1.1440 or extend the correction down to 1.1340. Later, the market may form one more ascending structure with the target at 1.1550. From the technical point of view, this scenario is confirmed by MACD Oscillator: its signal line is moving above 0 inside the histogram area, thus indicating a further uptrend on the price chart.

As we can see in the H1 chart, after forming a consolidation range around 1.1430 and breaking it to the upside, EUR/USD is expected to continue growing towards 1.1488 with no correction. This movement should be considered as an alternative scenario because the price may start plummeting to form such correction with the target at 1.1340 at any moment. From the technical point of view, this scenario is confirmed by Stochastic Oscillator: its signal line is moving above 80. If the line breaks 80 and starts plunging towards 20, it will confirm a sharp decline on the price chart.

Disclaimer

Any predictions contained herein are based on the author’s particular opinion. This analysis shall not be treated as trading advice. RoboForex shall not be held liable for the results of the trades arising from relying upon trading recommendations and reviews contained herein.

Are DAX30 bulls about to sustainably recapture 13,000 points?

By Admiral Markets

Economic events

Source: Economic Events July 2020 – Admiral Markets’ Forex Calendar

The economic calendar for the beginning of the trading week is quite thin. However, there are chances that today will set the stage for new trends in the coming days.

The reason for this? The EU summit over the weekend saw EU leaders moving towards an agreement on a roughly 1.85 trillion Euro European Corona pandemic recovery fund.

While not all details could be worked out (which could be expected, see our analysis from last Friday), steps in that direction seem to have been taken, leaving the German DAX30 with the potential for a run above 13,000 points by today and if not, in the very near future.

This bullish outlook remains on a technical level as long as we trade above 12,770/800 points, and on a longer time frame (Daily), recapturing 13,000 could lead the way up to the all-time high of around 13,800 points in the weeks ahead.

On the other hand: a drop below 12,770/800 would not necessarily darken the overall picture, but at least make a short-term run lower towards 12,470/500 points an option, stop-over around 12,670/700 points:

DAX30 hourly chart

Source: Admiral Markets MT5 with MT5-SE Add-on DAX30 CFD Hourly chart (between June 30, 2020, to July 17, 2020). Accessed: July 17, 2020, at 10:00pm GMT

DAX30 daily chart

Source: Admiral Markets MT5 with MT5-SE Add-on DAX30 CFD Daily chart (between April 3, 2019, to July 17, 2020). Accessed: July 17, 2020, at 10:00pm GMT – Please note: Past performance is not a reliable indicator of future results, or future performance.

In 2015, the value of the DAX30 CFD increased by 9.56%, in 2016, it increased by 6.87%, in 2017, it increased by 12.51%, in 2018, it fell by 18.26%, in 2019, it increased by 26.44% meaning that after five years, it was up by 34.2%.

Check out Admiral Markets’ most competitive conditions on the DAX30 CFD and start trading on the DAX30 CFD with a low 0.8 point spread offering during the main Xetra trading hours!

Discover the world’s #1 multi-asset platform

Admiral Markets offers professional traders the ability to trade with a custom, upgraded version of MetaTrader 5, allowing you to experience trading at a significantly higher, more rewarding level. Experience benefits such as the addition of the Market Heat Map, so you can compare various currency pairs to see which ones might be lucrative investments, access real-time trading data, and so much more. Click the banner below to start your FREE download of MT5 Supreme Edition!

Download MetaTrader 5 and begin trading today!

Disclaimer: The given data provides additional information regarding all analysis, estimates, prognosis, forecasts or other similar assessments or information (hereinafter “Analysis”) published on the website of Admiral Markets. Before making any investment decisions please pay close attention to the following:

  1. This is a marketing communication. The analysis is published for informative purposes only and are in no way to be construed as investment advice or recommendation. It has not been prepared in accordance with legal requirements designed to promote the independence of investment research, and that it is not subject to any prohibition on dealing ahead of the dissemination of investment research.
  2. Any investment decision is made by each client alone whereas Admiral Markets shall not be responsible for any loss or damage arising from any such decision, whether or not based on the Analysis.
  3. Each of the Analysis is prepared by an independent analyst (Jens Klatt, Professional Trader and Analyst, hereinafter “Author”) based on the Author’s personal estimations.
  4. To ensure that the interests of the clients would be protected and objectivity of the Analysis would not be damaged Admiral Markets has established relevant internal procedures for prevention and management of conflicts of interest.
  5. Whilst every reasonable effort is taken to ensure that all sources of the Analysis are reliable and that all information is presented, as much as possible, in an understandable, timely, precise and complete manner, Admiral Markets does not guarantee the accuracy or completeness of any information contained within the Analysis. The presented figures refer that refer to any past performance is not a reliable indicator of future results.
  6. The contents of the Analysis should not be construed as an express or implied promise, guarantee or implication by Admiral Markets that the client shall profit from the strategies therein or that losses in connection therewith may or shall be limited.
  7. Any kind of previous or modeled performance of financial instruments indicated within the Publication should not be construed as an express or implied promise, guarantee or implication by Admiral Markets for any future performance. The value of the financial instrument may both increase and decrease and the preservation of the asset value is not guaranteed.
  8. The projections included in the Analysis may be subject to additional fees, taxes or other charges, depending on the subject of the Publication. The price list applicable to the services provided by Admiral Markets is publicly available from the website of Admiral Markets.

Leveraged products (including contracts for difference) are speculative in nature and may result in losses or profit. Before you start trading, you should make sure that you understand all the risks.

By Admiral Markets

Gold and Oil: Be Aware of the “Spike”

“Hope and fear look different on a chart”

By Elliott Wave International

Recently in these pages, we noted that bull markets in stocks tend to end with “a subtly slowing ascent” rather than with a final “spike” higher, as many investors believe. Historical examples were provided.

It was also pointed out that, by contrast, commodities do tend to end major uptrends with a price spike.

The Wall Street classic book, Elliott Wave Principle: Key to Market Behavior, by Frost & Prechter explains why (keep in mind regarding the quote from the book that fifth waves are the final wave in the main trend of a financial market):

Fifth wave advances in the stock market are propelled by hope, while fifth wave advances in commodities are propelled by a comparatively dramatic emotion, fear; fear of inflation, fear of drought, fear of war. Hope and fear look different on a chart, which is one of the reasons that commodity market tops often look like stock market bottoms.

Crude oil offers a prime historical example. This chart shows the big spike higher going into the July 2008 high. A dramatic 78% plunge in just five months followed:

Of course, precious metals are also commodities. Thus, the price history of gold offers another historical example of a price spike going into a peak.

This chart and commentary are from the Sept. 2, 2011 Elliott Wave Financial Forecast, a monthly publication which provides analysis of major U.S. financial markets:

Commodity fifth waves in major rallies often end in a final spike higher. …

Gold’s wave structure is consistent with a terminating rise.

Four days after that chart published, on Sept. 6, 2011, a headline in the British newspaper, The Guardian, said:

Gold hits new high as fear stalks financial markets

There we have that word “fear” again.

On that date, the yellow metal hit a high of $1921.50 and a big decline followed. By December 2015, gold was trading at $1046.20.

Now, let’s return to the topic of crude oil — a market that’s seen extraordinarily dramatic moves in 2020, as you probably know.

This chart from the April 2020 Elliott Wave Financial Forecast shows when Elliott Wave International’s analysts made key calls on the crude oil market in recent history:

You can see the junctures at which the Elliott Wave Financial Forecast and the U.S. Short Term Update prepared Elliott Wave International’s subscribers for declines.

As the April Elliott Wave Financial Forecast noted:

The chart shows crude oil’s recent plunge. When we’ve felt the time was right to make comments on oil’s prospects, we’ve done so, as shown on the chart. Our last comment was in December 2019. Since January of this year, oil futures have crashed 71%.

Of course, the volatility in the crude oil market continued thereafter.

How would you like to get insights into the “forecasting tool” which EWI’s analysts employ?

You can do so — 100% free — via a valuable resource titled “The Forecasting Tool That Called Every Major Turn in Crude Oil Since 1993.”

Simply join Club EWI (membership is also free) and this video becomes instantly available to you. Club EWI is the world largest Elliott wave educational community.

Get started by following this link: “The Forecasting Tool That Called Every Major Turn in Crude Oil Since 1993.”

This article was syndicated by Elliott Wave International and was originally published under the headline Gold and Oil: Be Aware of the “Spike”. EWI is the world’s largest market forecasting firm. Its staff of full-time analysts led by Chartered Market Technician Robert Prechter provides 24-hour-a-day market analysis to institutional and private investors around the world.

Second Phase Real Estate Collapse Pending, Part II

By TheTechnicalTraders 

– In this second part of our research into what we believe is the US pending real estate collapse, we’ll explore more data supporting our expectations.  In the first part of this article, we highlighted the Case-Shiller data showing home price levels had already exceeded 2006-07 levels and how earning levels have collapsed after the COVID-19 virus event.  Our research team believes thee extremely high price levels, combined with the uncertainty of future earnings, unemployment, layoffs, and other economic contractions will result in a late 2020 or early 2021 shift in the residential real estate market.

We already know that commercial real estate has experienced one of the worst declines in decades.  Delinquencies have skyrocketed and thousands of US businesses have entered bankruptcies.  Main street and consumer services sectors will likely continue to feel the pain related to the post-COVID-19 economy for many months still.  The question before all investors should be “how will the price levels reflect the changes in earning and economic data throughout this transition?”

Our research team believes the contraction in earnings for the consumers as well as the extended unemployment levels will present a very real potential for future foreclosures and delinquencies in the residential real estate market.  We believe this process will begin to become noticeable approximately 6+ months after the COVID-19 shutdowns started – sometime near August or September 2020.  Once the destruction of earning levels properly reflects into the economic cycles and banks tighten lending opportunities, the scale of capable buyers will shrink at a time when home inventories may begin to skyrocket – very similar to the 2008-09 credit crisis.

Ever since the lower interest rates pushed mortgage levels below 3%, residential home sales have been booming.  This is likely because people in cities are wanting to move out of the city and into the suburbs for a healthier and less compacted lifestyle.  Additionally, many of these more rural areas present better home price levels and more value for people selling urban real estate.

Another aspect of this boom in rural home sales is that people wanted to escape the trap of the city and move to locations where they have more room and more ability to “live off the property instead of living off the supermarket or local outlets.  This process of urban escape could take many months or possibly years for qualified sellers to relocate out into the more rural areas.  The point being that urban real estate values may dramatically decline as a result of the mass exodus from the cities that are currently taking place.

US manufacturing continues to decline year over year which indicates that manufacturing jobs and output is far from recovering.  If we attempt to read between the lines, it suggests that one of the most important aspects of any economic recovery is still showing -10% year over year contraction.  This suggests a longer recovery process for manufacturing output and jobs.

US retail sales have also collapsed over the past 3+ months.  Although one could argue that e-commerce sales have made up for these losses, one has to understand that retail sales within the US employs a host of other people that support local and regional stores.  Sales clerks, managers, warehouse, delivery and shipping and other positions that would normally be associated with retail or retail services have contracted by as much as 10 to 15% (or more) over the past 3+ months.

Additionally, consumer activity, which includes retail sales and retail services, makes up more than 80% of the US GDP levels.  If manufacturing and retail/consumer activity levels have dropped by 10% to 15% or more over the past 3+ months and will continue a slow recovery process lasting many months, we believe the eventual shift and contraction in the real estate market could present a lasting collapse in prices for many urban and outlying areas.

Our researchers believe the Real Estate ETFs may experience a 20% to 40% decline over the next 3+ months as the reality of the urban exodus hits.  Cities like Miami, Los Angeles, Chicago, San Francisco, and dozens of others may see a dramatic decrease in demand as buyers focus on more rural areas and the new “work from home” environment.  We’re already seen some evidence from discussions with local real estate professionals that a shift in buying interests is taking place.  Now, we are watching the middle and upper scale real estate markets in urban areas to confirm our hypothesis.

Once we start to see price decreases in larger urban areas (like Los Angeles, New York, Miami, and other areas), particularly in the condo and apartment sectors, we’ll know the shift in buying is taking place.  We believe condos and apartments will be one of the first sectors hit as well as middle and upper scale real estate.  We are also watching the foreclosure and auction data to determine if and when new waves of defaults start to hit the marketplace.

After stating what we believe to be a factual interpretation of the current real estate marketplace and the transition that is taking place, we believe the real shock will come to some of the hottest urban markets in the US and abroad.  We believe areas like Miami, New York, Los Angeles, Seattle, Portland, and others will experience a sudden lack of demand which will translate into decreasing price levels and sales activity.  The COVID-19 virus event has suddenly prompted people to realize the urban lifestyle if fraught with some risks that are partially negated in a rural environment and away from the packed and busy cities.

If our research is correct, there is a very real opportunity for skilled technical traders to take advantage of the next downside price wave in IYR and REM.  We believe a 20% to 40% price contraction will take place over the next 3+ months prompting a new momentum base to set up near November or December of 2020.  This base level may become a temporary base level as we find out how the COVID-19 virus is affecting the US economy and how quickly or aggressively people are exiting the urban environment.  Overall, we believe this is an excellent opportunity for skilled technical traders to profit from a new downside price wave.

IYR may target $65 to $68 before finding any real support.  Extended downside selling may push IYR to levels near $55 to $60 over the next 6+ months.

REM price levels may collapse to $13 to $15 over the next 4+ months as we believe the shift towards selling the urban areas and the tightening bank standards may result in a more constricted buying phase.  Inventory in rural areas is limited – very limited.  This may prompt a wave of current sellers to attempt to “get out now” and then wait for/hunt for the best rural opportunities.

Attempting to read this shifting market is like trying to predict the weather 3 months out.  There are many various aspects of the real estate market that could subtly change how the market dynamics shift.  The one thing we are certain of at this point is that the COVID-19 virus as well as the social and political turmoil will not end until sometime after November/December 2020.  Therefore, we are certain to have another 6+ months of shifting markets which may peak shortly after the US Presidential election (although we doubt it).

We strongly believe the remainder of 2020 and most of 2021 may continue to prove very challenging for homeowners and people attempting to make transitions away from urban areas.  We are alerting you to these opportunities because we believe a very good opportunity exists in these trades and we believe the real estate market will continue to be one of the biggest transitional price rotations we’ve seen in the past 8+ years.  Trillions of dollars reside in both the residential and commercial real estate marketplaces and we believe a huge shift in these markets is about to unload on consumers/banks.

This could be one very big component of a fantastic trading opportunity for skilled technical traders.

Get our Active ETF Swing Trade Signals or if you have any type of retirement account and are looking for signals when to own equities, bonds, or cash, be sure to become a member of my Passive Long-Term ETF Investing Signals which we are about to issue a new signal for subscribers.

Chris Vermeulen
Chief Market Strategies
Founder of Technical Traders Ltd.

NOTICE: Our free research does not constitute a trade recommendation or solicitation for our readers to take any action regarding this research.  It is provided for educational purposes only.  Our research team produces these research articles to share information with our followers/readers in an effort to try to keep you well informed.

TheTechnicalTraders.com


Ichimoku Cloud Analysis 17.07.2020 (GBPJPY, USDZAR, EURNZD)

Article By RoboForex.com

GBPJPY, “Great Britain Pound vs Japanese Yen”

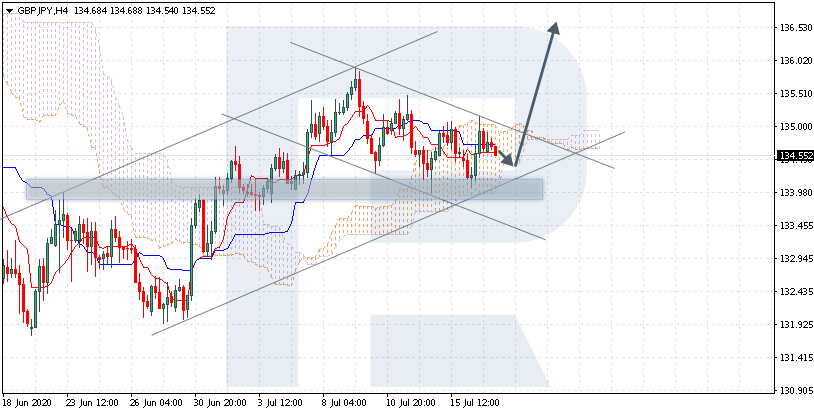
GBPJPY is trading at 134.55; the instrument is moving inside Ichimoku Cloud, thus indicating a sideways tendency. The markets could indicate that the price may test the cloud’s downside border at 134.05 and then resume moving upwards to reach 136.55. Another signal is favor of further uptrend will be a rebound from the rising channel’s downside border. However, the bullish scenario may no longer be valid if the price breaks the cloud’s downside border and fixes below 133.85. In this case, the pair may continue falling towards 132.95. To confirm further growth, the asset must break the descending channel’s upside border and fix above 135.35.

GBPJPY
Risk Warning: the result of previous trading operations do not guarantee the same results in the future

USDZAR, “US Dollar vs South African Rand”

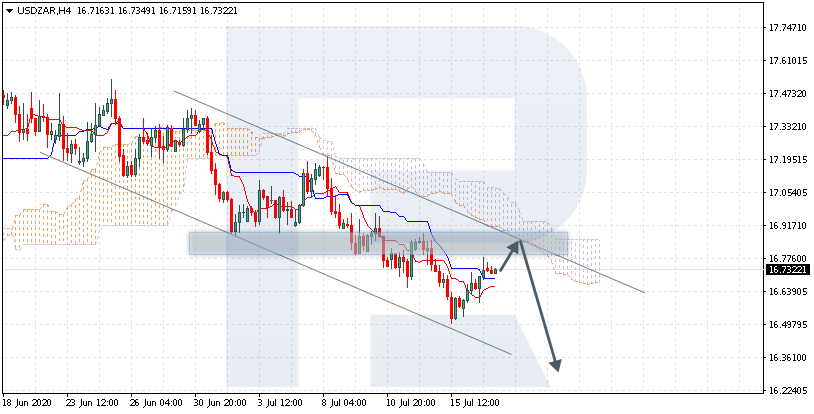
USDZAR is trading at 16.73; the instrument is moving below Ichimoku Cloud, thus indicating a descending tendency. The markets could indicate that the price may test the cloud’s downside border at 16.85 and then resume moving downwards to reach 16.25. Another signal in favor of further downtrend will be a rebound from the descending channel’s upside border. However, the bearish scenario may no longer be valid if the price breaks the cloud’s upside border and fixes above 17.00. In this case, the pair may continue growing towards 17.35.

USDZAR
Risk Warning: the result of previous trading operations do not guarantee the same results in the future

EURNZD, “Euro vs New Zealand Dollar”

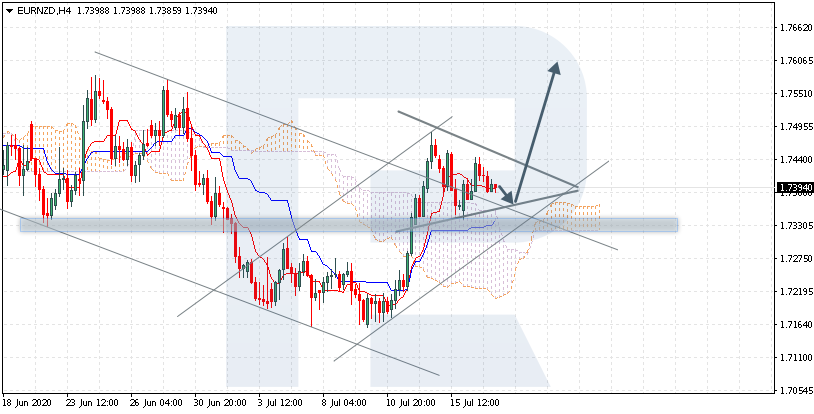
EURNZD is trading at 1.7394; the instrument is moving above Ichimoku Cloud, thus indicating an ascending tendency. The markets could indicate that the price may test Tenkan-Sen and Kijun-Sen at 1.7355 and then resume moving upwards to reach 1.7605. Another signal in favor of further uptrend will be a rebound from the descending channel’s upside border. However, the bullish scenario may no longer be valid if the price breaks the cloud’s downside border and fixes below 1.7205. In this case, the pair may continue falling towards 1.7110. To confirm further growth, the asset must break the upside border of the Triangle pattern and fix above 1.7450.

EURNZD

Article By RoboForex.com

Attention!
Forecasts presented in this section only reflect the author’s private opinion and should not be considered as guidance for trading. RoboForex LP bears no responsibility for trading results based on trading recommendations described in these analytical reviews.

Fibonacci Retracements Analysis 17.07.2020 (BITCOIN, ETHEREUM)

Article By RoboForex.com

BTCUSD, “Bitcoin vs US Dollar”

The daily chart has been showing the same technical picture as the week before. Bitcoin is falling to re-test 23.6% fibo after failing to reach the high at 10368.40. In the nearest future, the asset is expected to resume falling towards 38.2%, 50.0%, and 61.8% fibo at 7907.00, 7150.00, and 6390.00 respectively.

BTCUSD_D1
Risk Warning: the result of previous trading operations do not guarantee the same results in the future

As we can see in the H1 chart, the divergence made the pair stop growing at the mid-term 38.2% fibo and start a new downtrend, which has already reached 61.8% fibo and may continue towards 76.0% fibo at 8927.10 and then the low at 8814.20.

BTCUSD_H1
Risk Warning: the result of previous trading operations do not guarantee the same results in the future

ETHUSD, “Ethereum vs. US Dollar”

As we can see in the H4 chart, Ethereum is forming the mid-term correction between 23.6% fibo and the high at 214.90 and 253.47 respectively. The most probable scenario implies that the price may break 23.6% fibo and continue trading downwards to reach 38.2% and 50.0% fibo at 191.00 and 171.60 respectively.

ETHUSD_H4
Risk Warning: the result of previous trading operations do not guarantee the same results in the future

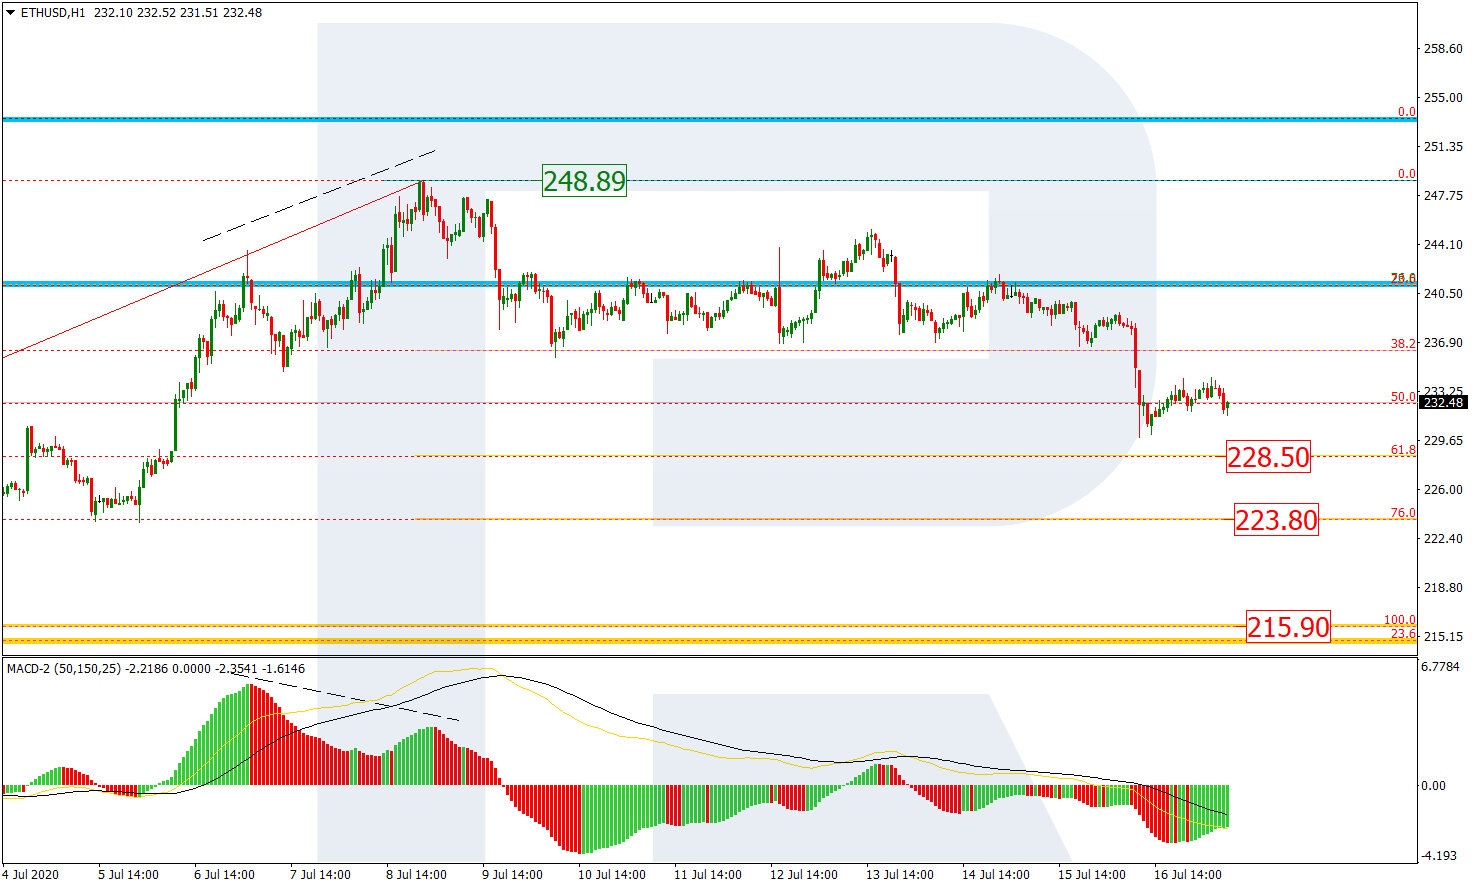
In the H1 chart, the divergence on MACD made the pair start a new descending wave, which has already reached 50.0% fibo. Later, the market may continue falling towards 61.8% and 76.0% fibo at 228.50 and 223.80 respectively and then the low at 215.90. The resistance is the high at 248.89.

ETHUSD_H1

Article By RoboForex.com

Attention!
Forecasts presented in this section only reflect the author’s private opinion and should not be considered as guidance for trading. RoboForex LP bears no responsibility for trading results based on trading recommendations described in these analytical reviews.

A tale of two coffee farmers: how they are surviving the pandemic in Honduras

By Allan Discua-Cruz, Lancaster University 

– I am a third-generation member of a farming family in Honduras. I fondly remember getting up before dawn every day and riding several miles on the back of a mule to join in the family coffee harvest.

You get involved in everything from tasting the coffee berries to see if they are ready, to picking and preparing them for drying in the sun. Every family has its own recipe for a final product: in our case, we would harvest cinnamon bark from trees on the farm and blend it with the ground beans.

My family is one of thousands that provide the world with its daily dose of caffeine by supplying beans with all their distinctive flavours to roasters and baristas everywhere. In normal times, around 2 billion cups of coffee are consumed worldwide every day.

But the coffee business has been hit hard by COVID-19 – particularly producers like my family who are dedicated to cultivating high-quality coffee for export. They are not used to selling coffee within the country and are not diversified into other agricultural products. Due to the pandemic, the government has imposed restrictions that have prevented millions of sacks of coffee from being exported.

Honduras is the sixth-largest coffee producer in the world, and several growers have achieved record prices in international coffee auctions in the past decade, and awards for the quality of their coffee. This has helped coffee-farming families to develop solid commercial relationships with buyers large and small.

Allan Discua-Cruz working on the family coffee farm.
Allan Discua Cruz

I contacted coffee-producing families in different areas of Honduras to talk about how they are getting by. They were experiencing unprecedented business disruption. Many farmers have seen their incomes swept away, and are having to dig deep to survive. Yet I was surprised at the resilience being shown by the people I talked to. Here are some of their stories:

Café Aruco: the cooperative

Donaldo Gonzalez is the general manager of Café Aruco, a large coffee cooperative of over 200 farmers in the north-west of Honduras:

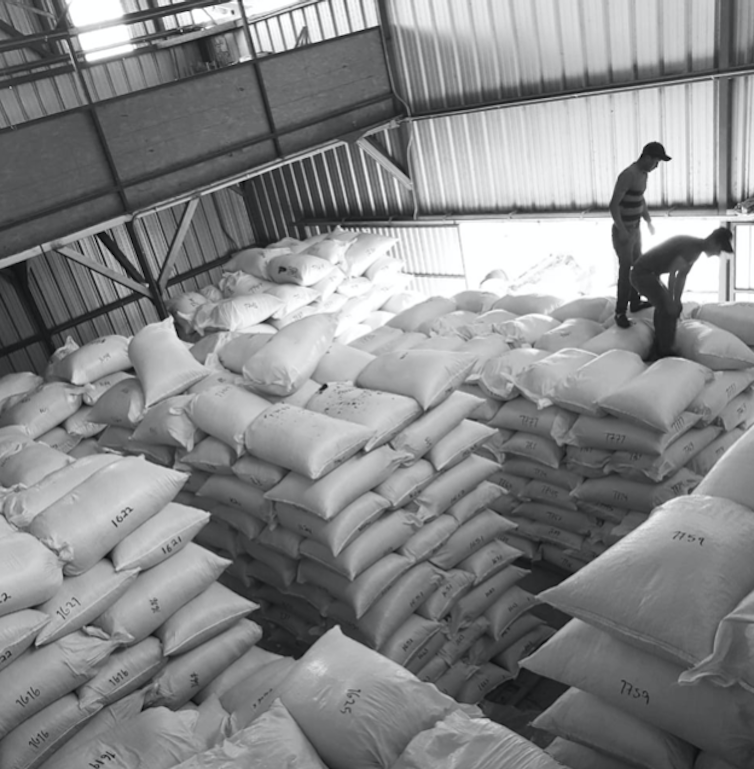
We had just finished collecting the coffee harvest in the early months of 2020 and our main warehouse was full. Last year we exported coffee to seven countries. We sent about 40,000 sacks and we were looking to send a similar or higher quantity this year.

Most of our harvest was ready to be packed and shipped. The contracts were already signed for our coffee to go the UK, the US and other international destinations. But suddenly, everything had to stop. It was surreal when we received telephone calls from our international buyers saying we could not ship our products because they would not be offloaded.

Fully stocked: the Café Aruco warehouse.
Allan Discua Cruz

Forced to cease trading and stay at home, Donaldo has been planting coffee trees with his children in the family farm. He has been them “tricks of the trade” that were handed down to him and sharing the stories of previous generations – the sort of thing for which time is normally very limited in farmers’ incredibly long days.

He said the lockdown has been a chance for him and other busy farmers in the cooperative to reconnect with colleagues by phone. They have shared ideas about adapting their processes to prevent the spread of the virus.

They have been discussing ways of maximising what they can sell locally – admittedly a much smaller market than export. This has flowed from efforts to help the country during the crisis, for example by giving coffee to local hospitals. Farmers in the cooperative are thinking about how to attract Hondurans from towns and cities to come and experience their coffee in its rural setting.

Our customers overseas are waiting to have our product in their shops and we are just waiting for the lockdown to be lifted. This crisis has allowed us to rethink how we can do business.

Café Papatoño: the family business

Leonardo Borjas is a third-generation member of a coffee-producing family in the south-east of the country. The family farms various other products, including livestock, and several years ago asked Leonardo to use his skills as an agricultural engineer to develop their coffee crop as a high-quality export.

In 2018 he introduced a range of gourmet roasted coffee products under the Café Papatoño brand, named after his grandfather, and started a high-end coffee shop under the same label. He told me:

As lockdown started we were facing challenging times. People would not be able to visit and purchase our products. We could not export anywhere. Also, international coffee prices remained low compared to previous years.

I have two choices. Either I allow this crisis to break me or it will allow me to break records. People in Honduras want coffee during the crisis. For some people coffee, is an affordable luxury. They are demanding coffee beans to grind at home or a good cup from our shop during lockdown.

The Borjas plantation.
Allan Discua Cruz

Leonardo described how he has introduced changes such as backpacks so that motorcyclists can deliver his product to people’s doors, and a system to allow people to pay for coffee in rural areas by phone.

He is now struggling to cope with local demand, having seen that customers are choosing his coffee over alternatives from popular chains. It’s a big contrast to the warnings friends gave him in 2018 that he would have a hard time convincing people to pay extra.

He believes that customers are buying his coffee both because of its quality and because he’s now communicating its values and heritage in the packaging. As he puts it, “quality speaks for itself, and in times of crisis that voice is louder”.

As international customers remain on standby during the crisis, coffee-farming families that have invested in improving coffee quality and communicating their story effectively will hopefully re-emerge stronger when demand returns.The Conversation

About the Author:

Allan Discua-Cruz, Senior Lecturer in Entrepreneurship, Lancaster University

This article is republished from The Conversation under a Creative Commons license. Read the original article.


The Analytical Overview of the Main Currency Pairs on 2020.07.17

by JustForex

The EUR/USD currency pair

Technical indicators of the currency pair:
  • Prev Open: 1.14096
  • Open: 1.13833
  • % chg. over the last day: -0.24
  • Day’s range: 1.13750 – 1.14064
  • 52 wk range: 1.0777  – 1.1494

The EUR/USD currency pair continues to consolidate. The technical pattern is ambiguous. The ECB, as expected, kept the key marks of monetary policy at the same level. An optimistic report on retail sales in the US for June supported the greenback. Investors are concerned about the growing number of people infected with COVID-19. On Thursday the US reported more than 77,000 new coronavirus cases, breaking the daily record. Several states have reintroduced restrictive measures. At the moment, EUR/USD quotes are consolidating in the range of 1.1370-1.1415. We recommend opening positions from these marks.

The news feed on 2020.07.17:
  • – Consumer price index in the Eurozone at 12:00 (GMT+3:00);
  • – Statistics on the US real estate market at 15:30 (GMT+3:00).
EUR/USD

Indicators do not give accurate signals: the price has fixed between 50 MA and 100 MA.

The MACD histogram is in the negative zone, but above the signal line, which gives a weak signal to buy EUR/USD.

Stochastic Oscillator is in the neutral zone, the %K line has crossed the %D line. There are no signals at the moment.

Trading recommendations
  • Support levels: 1.1370, 1.1325, 1.1300
  • Resistance levels: 1.1415, 1.1435, 1.1450

If the price fixes above 1.1415, further growth of EUR/USD quotes is expected. The potential movement to 1.1450-1.1480.

An alternative could be a decline in the EUR/USD currency pair to 1.1330-1.1300.

The GBP/USD currency pair

Technical indicators of the currency pair:
  • Prev Open: 1.25731
  • Open: 1.25519
  • % chg. over the last day: -0.25
  • Day’s range: 1.25379 – 1.25710
  • 52 wk range: 1.1466  – 1.3516

In the last sessions, trades on the GBP/USD currency pair are very active. At the same time, there is no defined trend. Financial market participants expect additional drivers. Demand for risky assets has weakened again amid new outbreaks of coronavirus infection. At the moment, the local support and resistance levels are 1.2540 and 1.2580, respectively. The trading instrument is tending to decline. Positions should be opened from key levels.

The news feed on the UK economy is calm.

GBP/USD

Indicators do not give accurate signals: the price has crossed the 50 MA and 100 MA.

The MACD histogram is in the negative zone, indicating the bearish sentiment.

Stochastic Oscillator is in the neutral zone, the %K line has crossed the %D line. There are no signals at the moment.

Trading recommendations
  • Support levels: 1.2540, 1.2520, 1.2485
  • Resistance levels: 1.2580, 1.2620, 1.2665

If the price fixes below 1.2540, GBP/USD quotes are expected to fall. The movement is tending to 1.2500-1.2480.

An alternative could be the growth of the GBP/USD currency pair to 1.2620-1.2640.

The USD/CAD currency pair

Technical indicators of the currency pair:
  • Prev Open: 1.35095
  • Open: 1.35659
  • % chg. over the last day: +0.47
  • Day’s range: 1.35640 – 1.35892
  • 52 wk range: 1.2949  – 1.4668

USD/CAD quotes have been growing. The trading instrument has updated local highs. The demand for risky assets is still low. At the moment, the loonie is consolidating in the range of 1.3560-1.3590. Today we recommend paying attention to the economic reports from the US, as well as to the dynamics of oil prices. We recommend opening positions from these marks.

At 15:30 (GMT+3:00), data on the volume of wholesale sales will be published in Canada.

USD/CAD

Indicators do not give accurate signals: the price has crossed the 100 MA.

The MACD histogram is in the positive zone, which indicates the bullish sentiment.

Stochastic Oscillator is in the neutral zone, the %K line is below the %D line, which gives a signal to sell USD/CAD.

Trading recommendations
  • Support levels: 1.3560, 1.3540, 1.3520
  • Resistance levels: 1.3590, 1.3610, 1.3635

If the price fixes above 1.3590, further growth in USD/CAD quotes is expected. The movement is tending to 1.3610-1.3630.

An alternative could be a decline in the USD/CAD currency pair to 1.3540-1.3520.

The USD/JPY currency pair

Technical indicators of the currency pair:
  • Prev Open: 106.930
  • Open: 107.214
  • % chg. over the last day: +0.31
  • Day’s range: 107.097 – 107.361
  • 52 wk range: 101.19  – 112.41

The technical pattern on the USD/JPY currency pair is still ambiguous. The trading instrument continues to consolidate. At the moment, the local support and resistance levels are 107.10 and 107.30, respectively. Investors expect additional drivers. We recommend paying attention to economic reports, as well as to the dynamics of the US government bonds yield. Positions should be opened from key levels.

The news feed on Japan’s economy is calm.

USD/JPY

Indicators do not give accurate signals: the price has crossed the 50 MA and 100 MA.

The MACD histogram is in the positive zone, but below the signal line, which gives a weak signal to buy USD/JPY.

Stochastic Oscillator is in the neutral zone, the %K line has crossed the %D line. There are no signals at the moment.

Trading recommendations
  • Support levels: 107.10, 106.95, 106.80
  • Resistance levels: 107.30, 107.40, 107.60

If the price fixes below 107.10, USD/JPY quotes are expected to fall. The movement is tending to 106.80-106.60.

An alternative could be the growth of the USD/JPY currency pair to 107.50-107.70.

by JustForex