By IFCMarkets
Corn rises on lower yield expectations
Corn prices advance on expectations of lower US corn yield ahead of Wasde report. Will the price of corn continue rising?
Corn prices have been rising ahead of the US Department of Agriculture’s Wasde report on world crop supply and demand. Traders are anxious to see whether the official US yield forecast of record 175.1 bushels per acre estimated last month will be revised up or down. A downgrade is considered more likely, to 173.4 bushels per acre, which explains the streak of recent gains as harvest nears. At the same time a better weather forecast weighs on corn prices with weather service MDA reporting the rains will decrease in western and central US crop areas in six-to-10 day timeframe and warmer weather will improve corn crop condition.
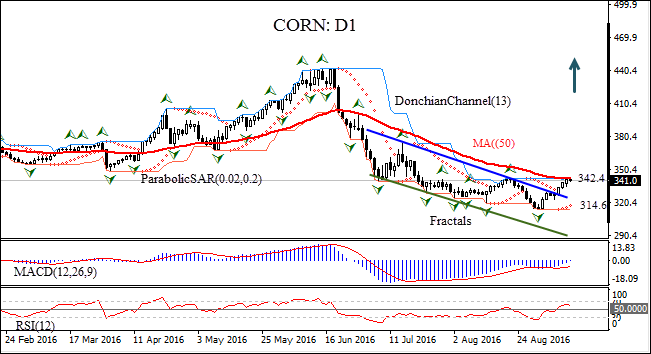
On the daily timeframe CORN:D1 has been correcting upward after hitting a seven year low in the end of August. The price has breached above the upper bound of the downward channel, and has reached the 50-day moving average MA(50) and last fractal high.
- The Donchian channel is flat: no trend is indicated.
- The Parabolic indicator gives a buy signal.
- The RSI oscillator oscillator has risen above the 50 level, but hasn’t reached the overbought zone.
- The MACD indicator is above the signal line and the gap is narrowing, which is a bullish signal.
We believe breaching above the upper Donchian boundary at 342.4 will signify continuation of the bullish momentum. It can be used as an entry point and a pending order to buy can be placed above that level. The stop loss can be placed below the last fractal low at 314.6, confirmed also by lower Donchian boundary. After placing the pending order the stop loss is to be moved every day following Parabolic signals. Thus, we are changing the probable profit/loss ratio to the breakeven point. If the price meets the stop loss level (314.64) without reaching the order (342.4), we recommend cancelling the position: the market sustains internal changes which were not taken into account.
Free Reports:
 Get Our Free Metatrader 4 Indicators - Put Our Free MetaTrader 4 Custom Indicators on your charts when you join our Weekly Newsletter
 Get our Weekly Commitment of Traders Reports - See where the biggest traders (Hedge Funds and Commercial Hedgers) are positioned in the futures markets on a weekly basis.
Technical Analysis Summary
| Position | Buy |
| Buy stop | Above 342.4 |
| Stop loss | Below 314.64 |
Market Analysis provided by IFCMarkets