By IFCMarkets
Precious metals went up on weaker US dollar
The ISM non-manufacturing PMI came out in US on Tuesday. Markets usually do not pay too much attention to this index but for this time. The index fell significantly which made US interest rate hike less probable. Market reaction was no surprise – US dollar index fell and precious metals rose. Will platinum platinum continue rising?
ISM reported the non-manufacturing PMI fell to 51.4 points – its low since February 2010. This is far below the 55 points expected by the markets and its July reading of 55.5 points. The monthly fall of the index was record since November 2008. Soon after the release of such weak data the chances for the Fed rate hike on September 21 fell to 15%. Before the data the chances were around 30%, according to Fed funds futures. The December rate hike is 50% probable now. Nevertheless, all this weighed on US dollar. Recently it has been rising only on expectations of the Fed interest rate hike. Precious metals have long been considered by investors as alternative to dollar assets and their prices are negatively correlated with US currency. Let’s consider the scenario of continued increase in platinum prices. They may rise, among others, on strike of Association of Mineworkers and Construction Union in South Africa. The country is world leader in platinum production and stocks. Since the start of the year the metal soared 26% while gold – 27%. At the same time, the platinum stockpiles in world largest ETFs fell 6% while those of gold surged 29% (in line with prices).
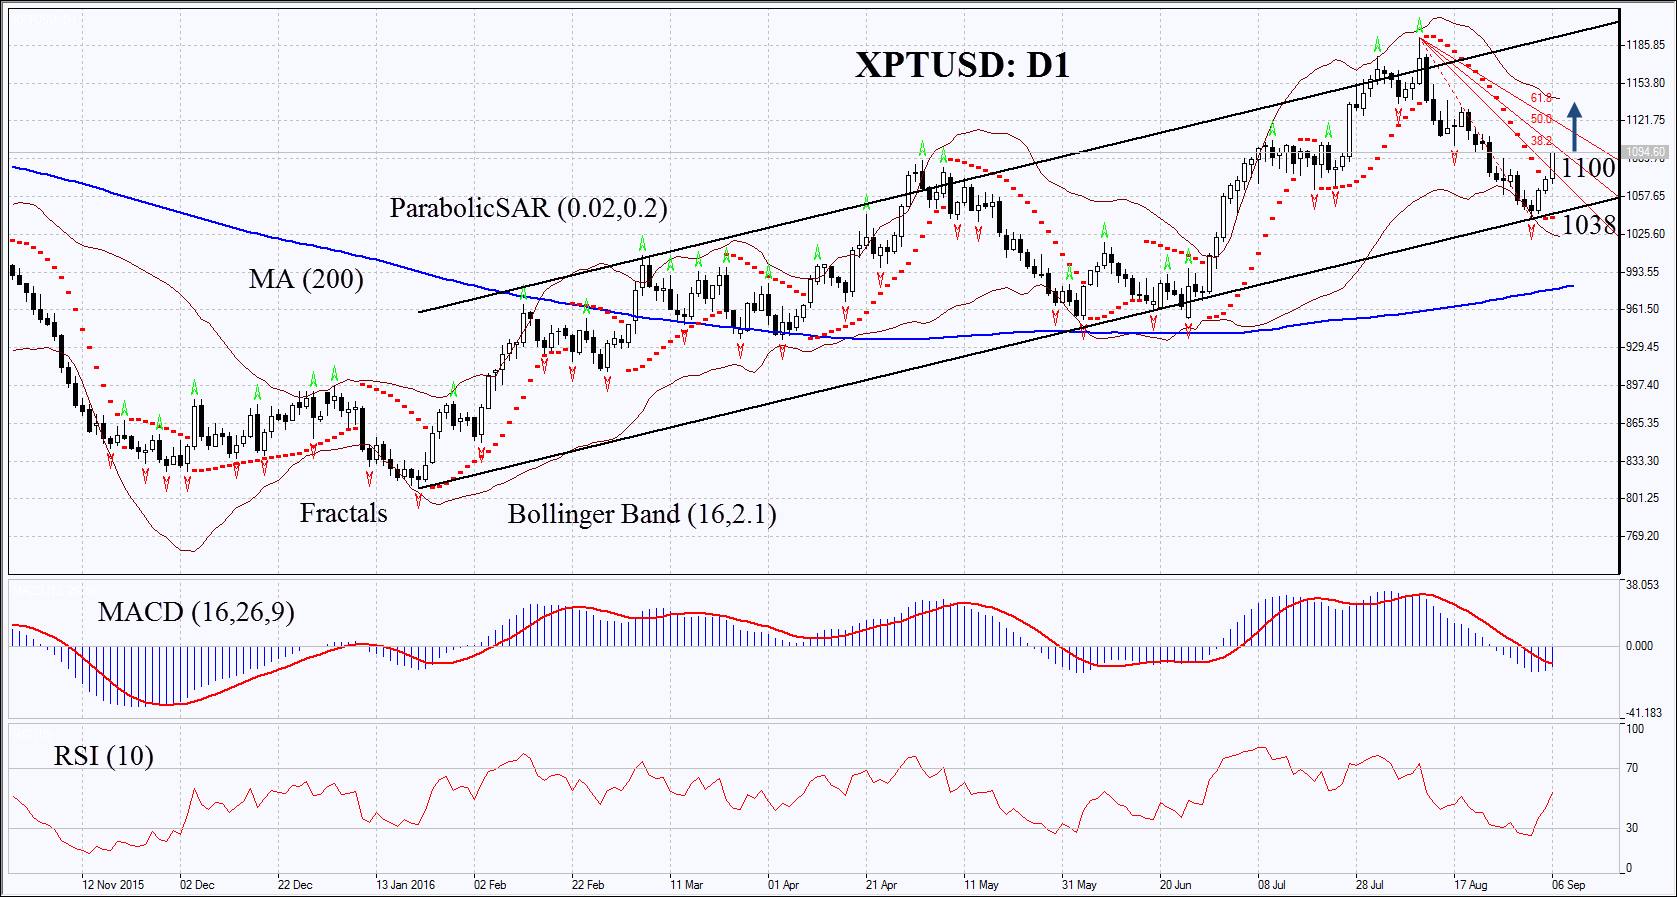
On the daily chart XPTUSD: D1 has been falling for the recent 4 weeks, having reached the support of the rising trend but failed to break down through it and started correcting up. The upward movement within the rising channel may continue if US Fed keeps interest rate the same.
- Parabolic indicator gives bullish signals.
- Bollinger bands remain quite wide which shows usual volatility for the instrument.
- RSI has surpassed the level of 50, no divergence.
- MACD is close to upward reversal but continues showing bearish signals.
The bullish momentum may develop in case the platinum surpasses the Fibonacci Fan level of 50 at 1100. In such a case MACD will already reverse up. This level may serve the point of entry. The initial stop-loss may be placed below the Parabolic signal, the last fractal low and the support of the rising trend at 1038. Having opened the pending order we shall move the stop to the next fractal low following the Parabolic and Bollinger signals. Thus, we are changing the probable profit/loss ratio to the breakeven point. The most risk-averse traders may switch to the 4-hour chart after the trade and place there a stop-loss moving it in the direction of the trade. If the price meets the stop-loss level at 1038 without reaching the order at 1100, we recommend cancelling the position: the market sustains internal changes which were not taken into account.
Free Reports:
 Get Our Free Metatrader 4 Indicators - Put Our Free MetaTrader 4 Custom Indicators on your charts when you join our Weekly Newsletter
 Get our Weekly Commitment of Traders Reports - See where the biggest traders (Hedge Funds and Commercial Hedgers) are positioned in the futures markets on a weekly basis.
Summary of technical analysis
| Position | Buy |
| Buy stop | above 1100 |
| Stop loss | below 1038 |
Market Analysis provided by IFCMarkets