By IFCMarkets
The positive economic data came out in US on Tuesday. The chances for the Fed rate hike late in 2016 are 55%, according to FedWatch futures on СМЕ exchange. At the same time, the European economic indicators came out weak on Tuesday. Will the euro continue weakening against the US dollar?
US dollar started strengthening after the Fed members spoke last Friday. They said the chances for the Fed rate hike remain quite high this year as US economy continues improving. The consumer confidence index for August came out positive on Tuesday, it was 101.1 points, much above the forecasted 97 points. This is its record high since October 2015. The additional positive came from the US Fed Vice-President Stanley Fisher who said the US labour market was close to full employment. The key indicator for August – Non-farm Payrolls – will come out on Friday September 2. Against this backdrop the European data on Tuesday could disappoint investors as all manufacturing and service PMIs fell in Eurozone in August as well as business climate and consumer confidence. In Germany the consumer price index was flat in August compared to July which slightly raises deflation risks. On Wednesday many significant economic indicators will come out in US and Eurozone. The most significant may be the US employment data from ADP and unemployment and inflation in Eurozone.
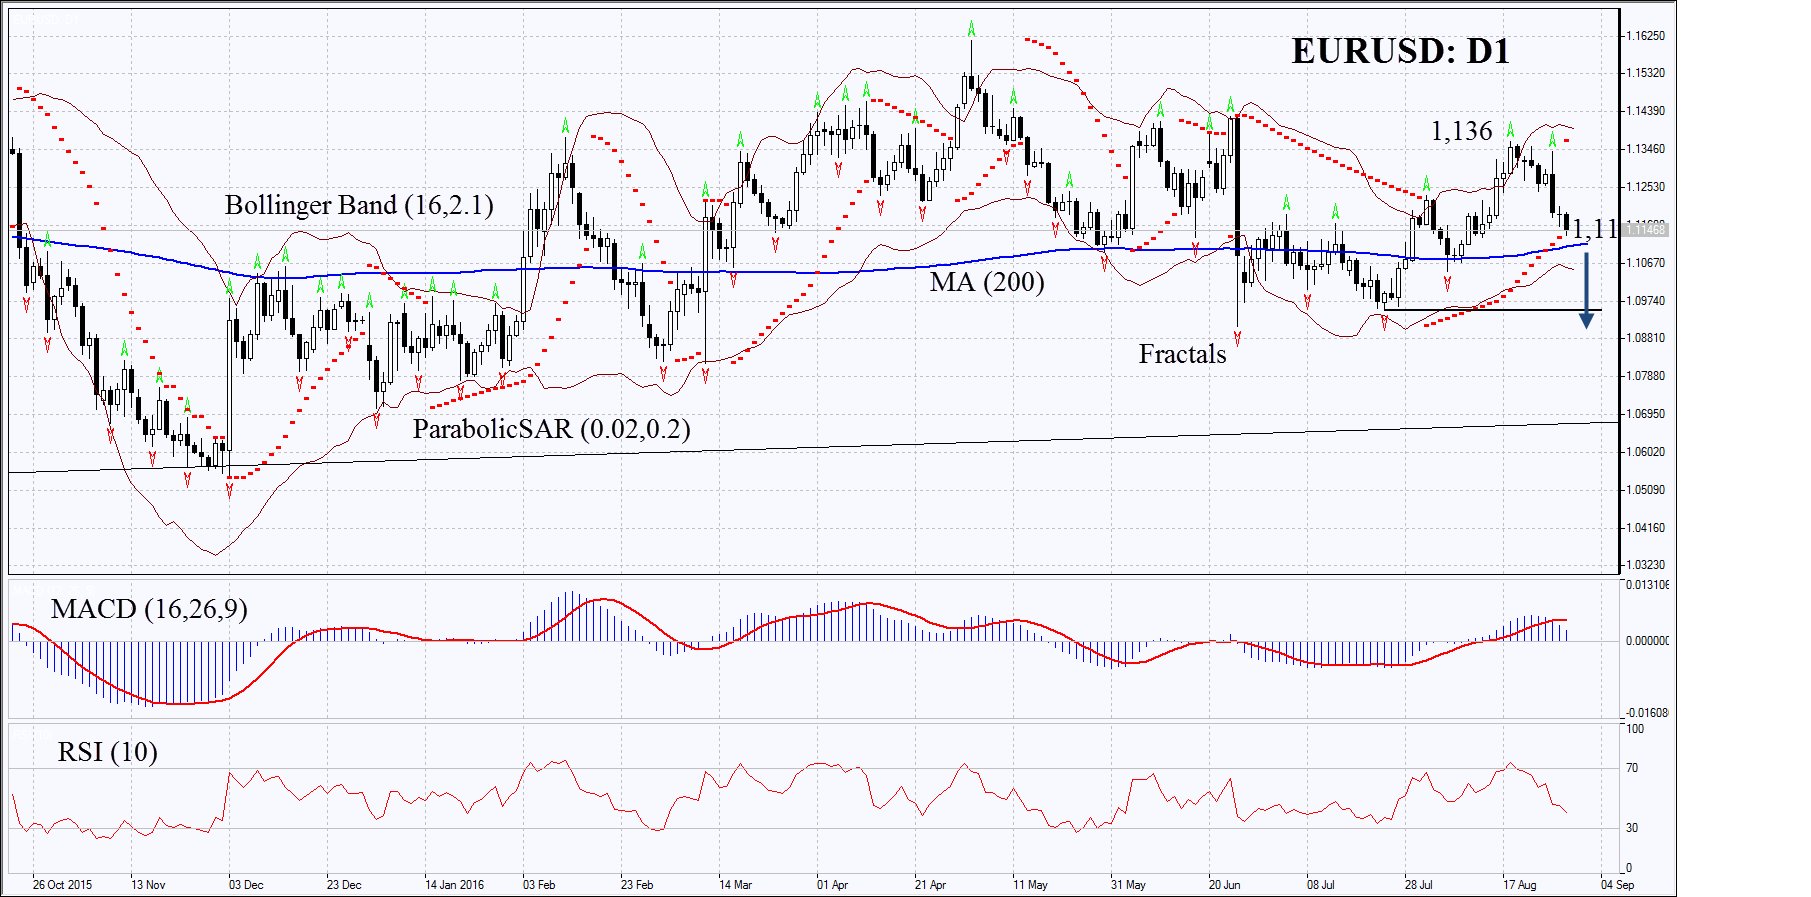
On the daily chart EURUSD: D1 has been in wide-range neutral trend for more than a year. In recent two weeks is has been moving towards the lower boundary. If the US labour market data prove to be positive, the dollar may continue strengthening against the euro.
- MACD has formed downward signal.
- Parabolic has formed bearish signal. It may be used as additional stop-loss.
- Bollinger bands have widened a bit which means moderate volatility. They are tilted down.
- RSI has fallen below 50 but has not yet reached the oversold zone. No divergence.
The bearish momentum may develop in case the EURUSD breaks down through its 200-day moving average and falls below the two last Parabolic signals at 1.11. This level may serve the point of entry. The initial stop-loss may be placed above the Parabolic signal and the two last fractal lows at 1.136. Having opened the pending order we shall move the stop to the next fractal high following the Parabolic and Bollinger signals. Thus, we are changing the probable profit/loss ratio to the breakeven point. The most risk-averse traders may switch to the 4-hour chart after the trade and place there a stop-loss moving it in the direction of the trade. If the price meets the stop-loss level at 1.136 without reaching the order at 1.11, we recommend cancelling the position: the market sustains internal changes which were not taken into account.
Market Analysis provided by IFCMarkets