By IFCMarkets
Awaiting GDP data in Canada
The Q2 GDP data will come out in Canada on Wednesday. The data are expected to be negative. Will the Canadian dollar continue weakening? It will look as growth on its chart.
The Canadian GDP will fall in Q2 2016 by 1.5% YoY after its rise by 2.4% in Q1, according to forecasts. If the investor expectations come true, this will be the record fall of Canadian economy since Q2 2009. The negative trend was caused by wildfires in Alberta province which hindered oil exports. The additional negative for USDCAD may come from the Fed plans to raise rates this year. This supports the US currency. The base rate is currently 0.5% in Canada. The chances for the rate hike are just 26% now.
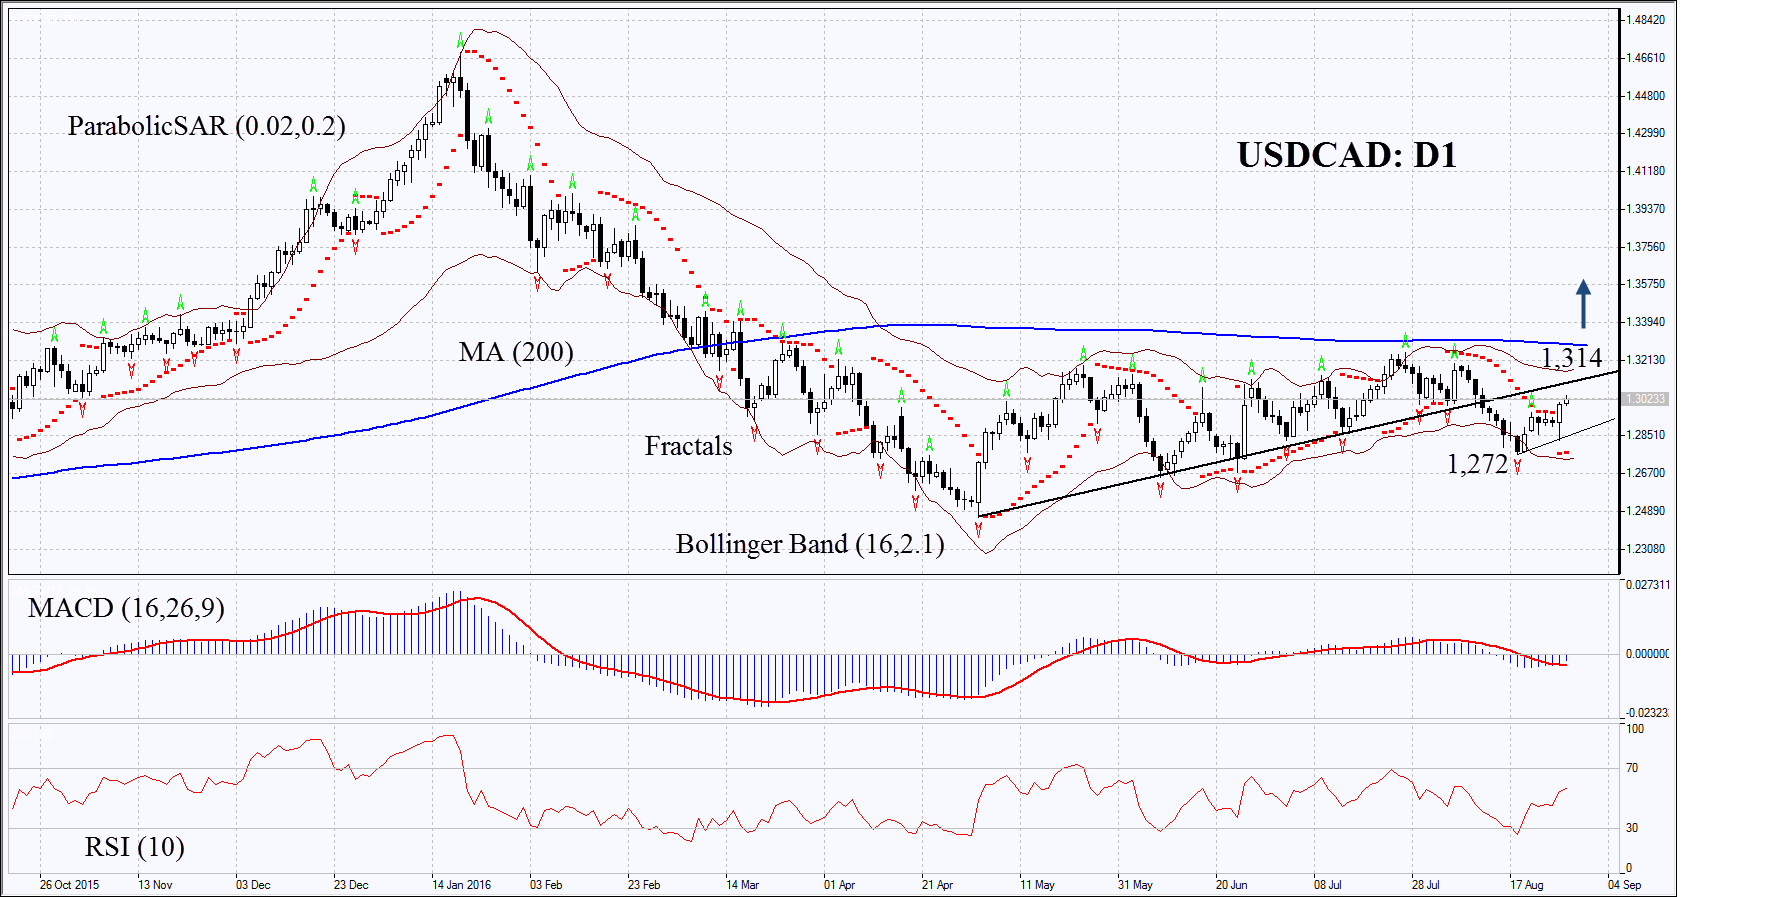
On the daily chart USDCAD is struggling for getting back into the rising channel. To do that, it has to break through the previous support which has become the resistance line now. The negative GDP data may weaken the Canadian currency.
- MACD has formed a signal to buy.
- Parabolic has also formed a signal to buy which can be used as additional level of support.
- Bollinger bands have widened a bit which means moderate volatility.
- RSI oscillator has surpassed the level of 50 but has not yet reached the overbought zone, no divergence.
The bullish momentum may develop in case the USDCAD returns to the previous rising trend and breaks through its support to the up at 1.314. This level may serve the point of entry. The initial stop-loss may be placed below the Parabolic signal, the Bollinger band and the last fractal low at 1.272. Having opened the pending order we shall move the stop to the next fractal low following the Parabolic and Bollinger signals. Thus, we are changing the probable profit/loss ratio to the breakeven point. The most risk-averse traders may switch to the 4-hour chart after the trade and place there a stop-loss moving it in the direction of the trade. If the price meets the stop-loss level at 1.314 without reaching the order at 1.272, we recommend cancelling the position: the market sustains internal changes which were not taken into account.
Free Reports:
 Get Our Free Metatrader 4 Indicators - Put Our Free MetaTrader 4 Custom Indicators on your charts when you join our Weekly Newsletter
 Get our Weekly Commitment of Traders Reports - See where the biggest traders (Hedge Funds and Commercial Hedgers) are positioned in the futures markets on a weekly basis.
Summary of technical analysis
| Position | Buy |
| Buy stop | above 1.314 |
| Stop loss | below 1.272 |
Market Analysis provided by IFCMarkets