By IFCMarkets
On Friday in the US the data on the labor market for July was released. It was much better than the preliminary forecasts. The U.S stock Indices and the dollar index rose sharply, while precious metals fell. As a rule, market participants consider them as alternatives to the US assets. Will the palladium continue declining?
The US Non-farm Payrolls rose 255 thousand for June which is far higher than the preliminary growth forecast: 180 thousand. June indicator was revised upward from 287 thousand to 292 thousand. According to CME Group’s FedWatch tool, the probability of a December Fed rate hike rose from 34% to 46%. Following this, the rise of the US dollar had a negative effect on prices of all precious metals. However, there is also an additional negative for palladium. This metal is widely used for catalytic converters in the automobile industry. Meanwhile, there is a decline in catalytic converters sales in the US and China. Sales of new cars in the US rose for 8 consecutive years and in 2015 recorded a new historical high: 17.5 million cars.
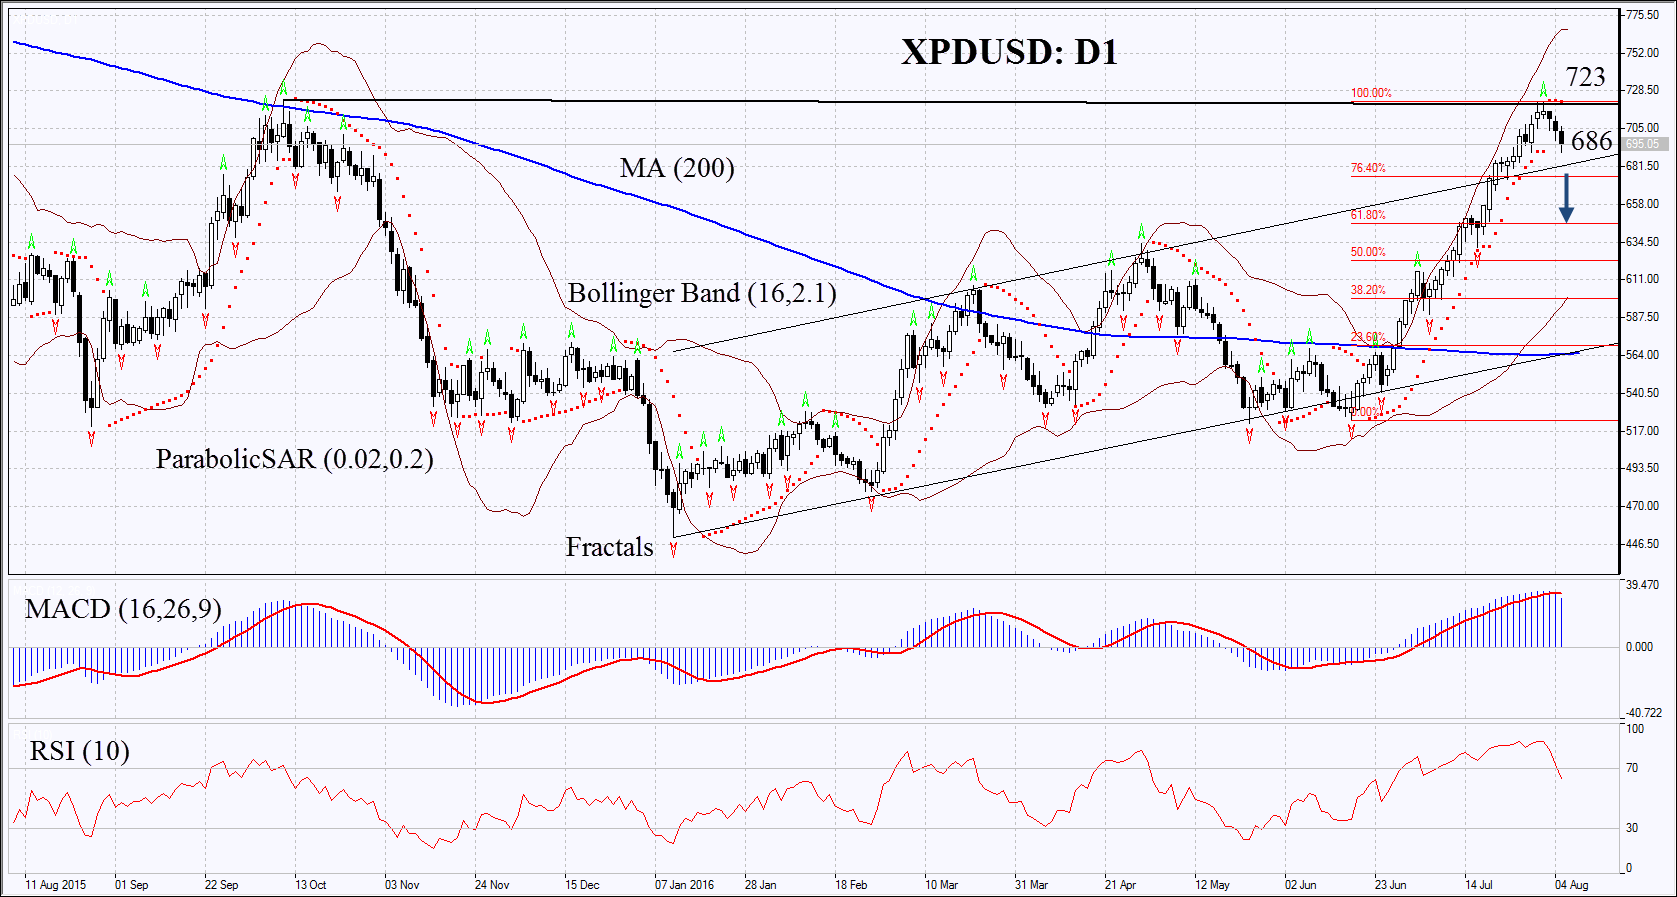
On the daily chart XPDUSD: D1 reached the highest since October last year and began to decline. The MACD and Parabolic indicators have formed signals to sell. The Bollinger bands have widened which means higher volatility. The RSI indicator has left the overbought zone. No divergence. The bearish momentum may develop in case the palladium falls below the lowest Parabolic level: 686. This level may serve the point of entry. The initial stop-loss may be placed above the last fractal high, Parabolic signal and the yearly high at 723. Having opened the pending order we shall move the stop to the next fractal high following the Parabolic and Bollinger signals. Thus, we are changing the probable profit/loss ratio to the breakeven point. The most risk-averse traders may switch to the 4-hour chart after the trade and place there a stop-loss moving it in the direction of the trade. If the price meets the stop-loss level at 723 without reaching the order at 686, we recommend cancelling the position: the market sustains internal changes which were not taken into account.
| Position | Sell |
| Sell stop | below 686 |
| Stop loss | above 723 |
Market Analysis provided by IFCMarkets