By IFCMarkets
The Reserve Bank of Australia (RBA) released on Monday the statement of its July meeting according to which the bank considers rate cut on its next meeting on August 2, 2016. The rate is currently at historical low of 1.75%. RBA will base its rate decision on inflation data, labour and real estate markets performance. Will Aussie continue weakening?
The unemployment in Australia rose in June to 5.8% up from 5.7% in May. The data came out on July 14 and pushed the Aussie lower as they give ground for rate cut. Now market participants expect even more important inflation data for Q2 which will come out on July 27, 2016. The consumer confidence index advanced 1.3% year on year in Q1. The real estate data for June will come out on August 1 – the day before the RBA meeting. No significant economic forecasts are in sight so market participants give a 50-50 chance of rate cut in Australia by 0.25%. Last time RBA cut the rate this April from 2% to current 1.75%. The rates may be cut also in neighbouring New Zealand. Now the rates there are at historical low of 2.25% with 0.4% inflation year on year. However, official data show the 50% increase in real estate prices since 2010, so the Bank holds off rate cut. Nevertheless, investors give again the 50-50 chance of rate cut like in Australia. The next meeting of New Zealand’s Reserve Bank will take place on August 11. It will most likely take into account the RBA rate decision so we are focusing on Australian dollar. But the weakening of NZDUSD is also possible.
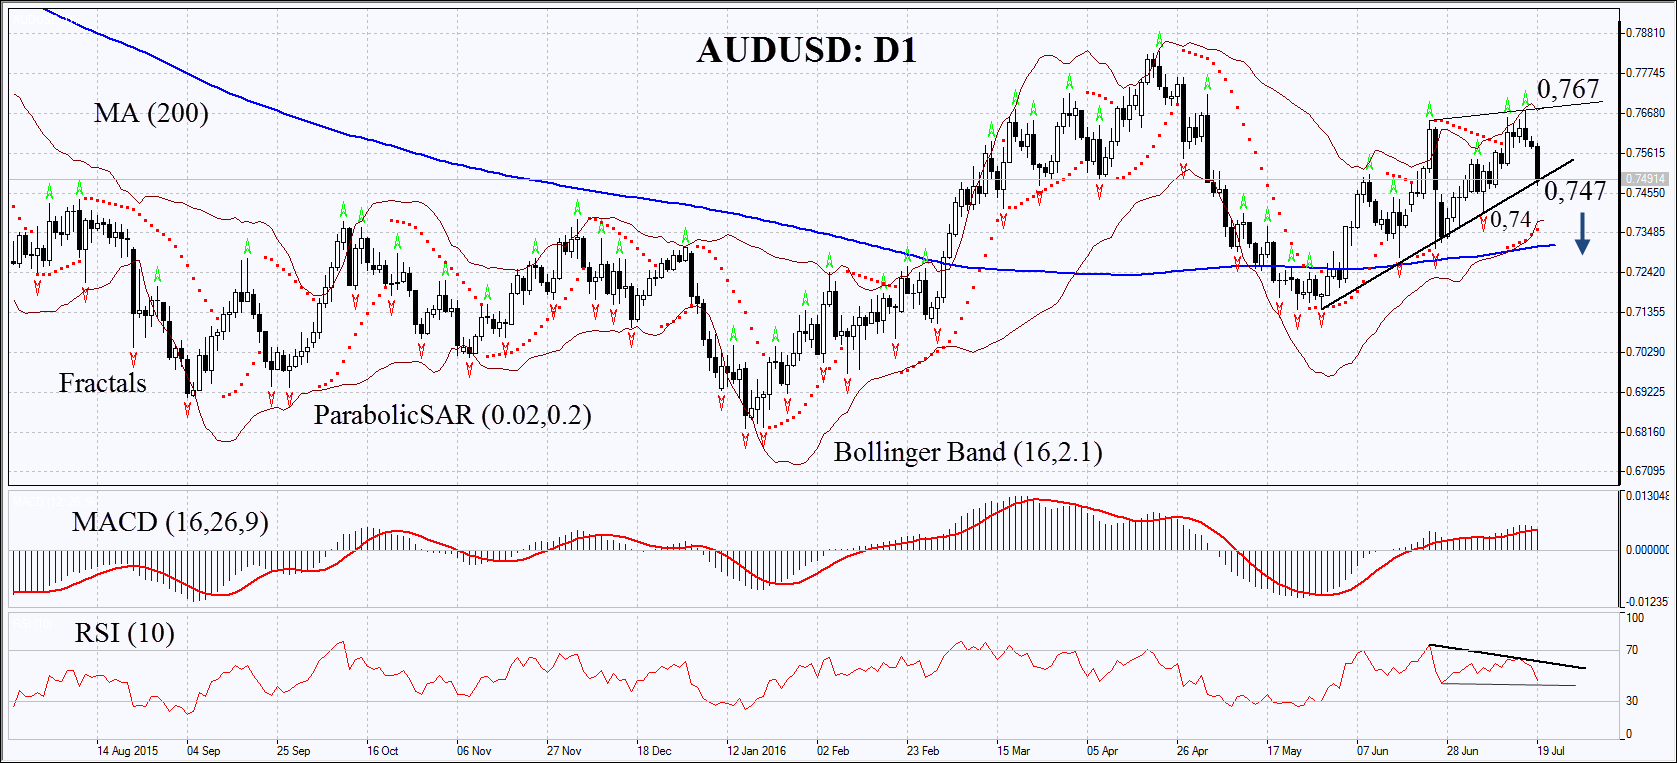
On the daily chart AUDUSD: D1 has approached its support of the rising trend. MACD has formed signal to sell. Parabolic has not reversed down and its signal to buy may serve an additional level of support. The Bollinger bands have narrowed slightly which means moderate volatility. RSI is below 50 and has formed negative divergence. The bearish momentum may develop in case the Australian dollar falls below the support of the rising trend at 0.747. This level may serve the point of entry. The most risk-averse traders may wait for break through the last fractal low at 0.74. The initial stop-loss may be placed above the Bollinger band and the last fractal high at 0.767. Having opened the pending order we shall move the stop to the next fractal high following the Parabolic and Bollinger signals. Thus, we are changing the probable profit/loss ratio to the breakeven point. The most risk-averse traders may switch to the 4-hour chart after the trade and place there a stop-loss moving it in the direction of the trade. If the price meets the stop-loss level at 0.767 without reaching the order at 0.747 or 0.74, we recommend cancelling the position: the market sustains internal changes which were not taken into account.
| Position | Sell |
| Sell stop | below 0.747 or 0.74 |
| Stop loss | above 0.767 |
Market Analysis provided by IFCMarkets