By IFCMarkets
Important economic data will come out in Japan on Friday: trade balance and current account balance for May. We believe the preliminary forecasts are negative. Will it push down the yen? On chart it will look as growth.
May inflation data came out in Japan last week. It fell for the 3rd straight month which means deflation. The BoJ head Haruhiko Kuroda in its speech on Thursday may hint on further plans of monetary stimulus of the economy. The Bank of Japan aims at 2% inflation till March 2018. Monetary stimulus is affected by issuing yen and cutting rates and may weigh on Japanese currency. Another factor is expected decline in positive trade balance of Japan in May to 56bn yen from 697bn yen in April. Data are to come out on Friday.
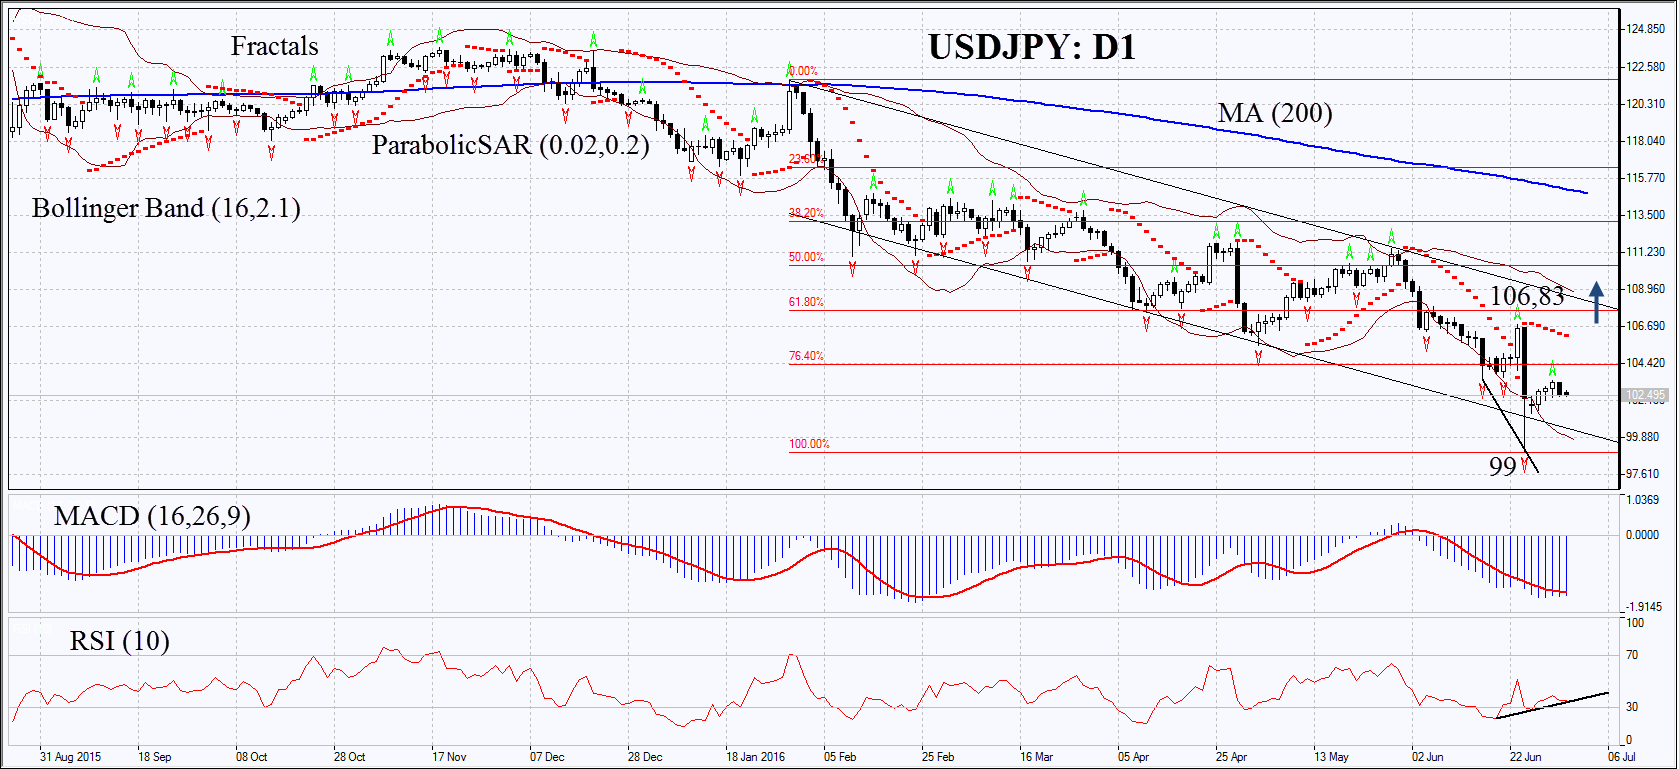
On the daily chart USDJPY: D1 has hit a fresh low since November 2013. The MACD and Parabolic indicators continue giving signals to sell. The Bollinger bands have widened which means higher volatility. RSI has left the oversold zone and formed positive divergence. The bullish momentum may develop in case the yen surpasses the 2nd fractal high and the Parabolic signal at: 106.83. This level may serve the point of entry. The initial stop-loss may be placed below the last fractal low and multi-month low at 99. Having opened the pending order we shall move the stop to the next fractal low following the Parabolic and Bollinger signals. Thus, we are changing the probable profit/loss ratio to the breakeven point. The most risk-averse traders may switch to the 4-hour chart after the trade and place there a stop-loss moving it in the direction of the trade. If the price meets the stop-loss level at 99 without reaching the order at 106.83, we recommend cancelling the position: the market sustains internal changes which were not taken into account.
| Position | Buy |
| Buy stop | above 106.83 |
| Stop loss | below 99 |
Market Analysis provided by IFCMarkets