By IFCMarkets
Copper prices advanced on Wednesday after the strong economic data came out in China. The volume of new loans rose in May to 985.5bn yuan ($149.6bn) which is far above the expected 750bn yuan. China accounts for 46% of global copper consumption. This metal is actively used as collateral. Will the copper edge up?
The volume of new loans fell in China in April 2016 to the 6-month low of 556bn yuan. Meanwhile, the China’s imports of refined copper tumbled 25% since March while the copper concentrate imports fell 8%. The external trade data for May came out last week. The total imports of China dipped only 0.4% year on year after their slump of 10.9% in April. Exports declined 4.1% after fall by 1.8% in April. Market participants assume this point at higher internal demand in China. Together with improved lending, this may support demand for copper. The China’s industrial production and retail sales in May were the same as in April. As for negative, the London Metal Exchange reports that the total net long position in copper fell last week to 9.8 thousand lots from 24.8 thousand lots previous week. Most market participants do not expect substantial price growth.
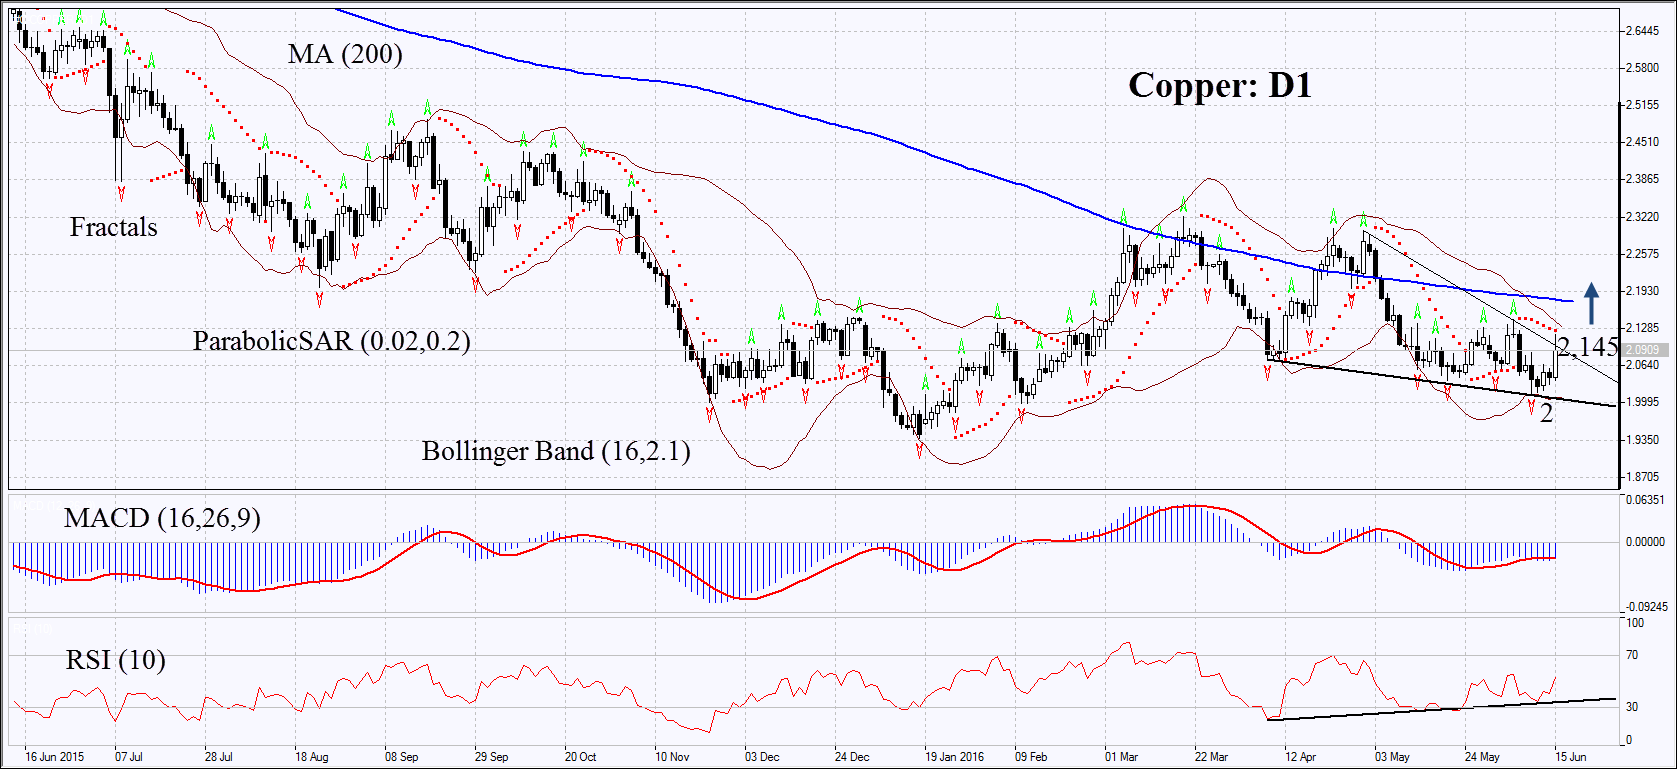
On the daily chart Copper: D1 has approached the resistance of the short-term downtrend but failed to surpass it. The MACD has formed signal to buy while Parabolic still gives signal to sell. It may be used as resistance that shall be surpassed to form the uptrend. In our opinion, the resistance it quite strong. The Bollinger bands have contracted significantly which means extremely low volatility. The bullish momentum may develop in case the copper surpasses the last fractal high, the Bollinger band and the Parabolic signal at 2.145. This level may serve the point of entry. The initial stop-loss may be placed below the Bollinger band and the last fractal low at 2.014 or 2. Having opened the pending order we shall move the stop to the next fractal low following the Parabolic and Bollinger signals. Thus, we are changing the probable profit/loss ratio to the breakeven point. The most risk-averse traders may switch to the 4-hour chart after the trade and place there a stop-loss moving it in the direction of the trade. If the price meets the stop-loss level at 2.014 or 2 without reaching the order at 2.145, we recommend cancelling the position: the market sustains internal changes which were not taken into account.
| Position | Buy |
| Buy stop | above 2.145 |
| Stop loss | below 2.014 or 2 |
Market Analysis provided by IFCMarkets