By IFCMarkets
Cocoa prices advanced and got back into the rising trend. Cote-d’Ivoire is planning to raise the local tax for cocoa crushing plants by almost 70% from $0.07 to $0.12 per kg. Market participants worry this may push the prices up. Cote-d’Ivoire is currently processing 720 thousand tonnes of cocoa beans each year which is almost half of its crops. Only 60-80% of the country’s 12 plants total capacity is employed which means the processing volumes may rise.
Cote-d’Ivoire accounts for around 35% of global cocoa crops. The country has doubled the processing capacity since 2010. Now the national government has already approved of higher taxes for processing companies. However, IMF and World Bank shall approve of the decision for it to come into effect as Cote-d’Ivoire participates in their programs of economic development. Export of fresh raw cocoa-beans from this African state fell 5.4% in October-April 2015/16 compared to same period of 2014/15 to 244.3 thousand. Another factor which may push cocoa prices up is bad weather in Brazil. The supplies of cocoa beans from the country’s main agricultural regions to the wholesale stores slumped 34% compared to May 2015. International Cocoa Organization increased last month the outlook for global cocoa deficit in 2015/16 farming year to 180 thousand tonnes compared to 113 thousand tonnes in previous estimate.
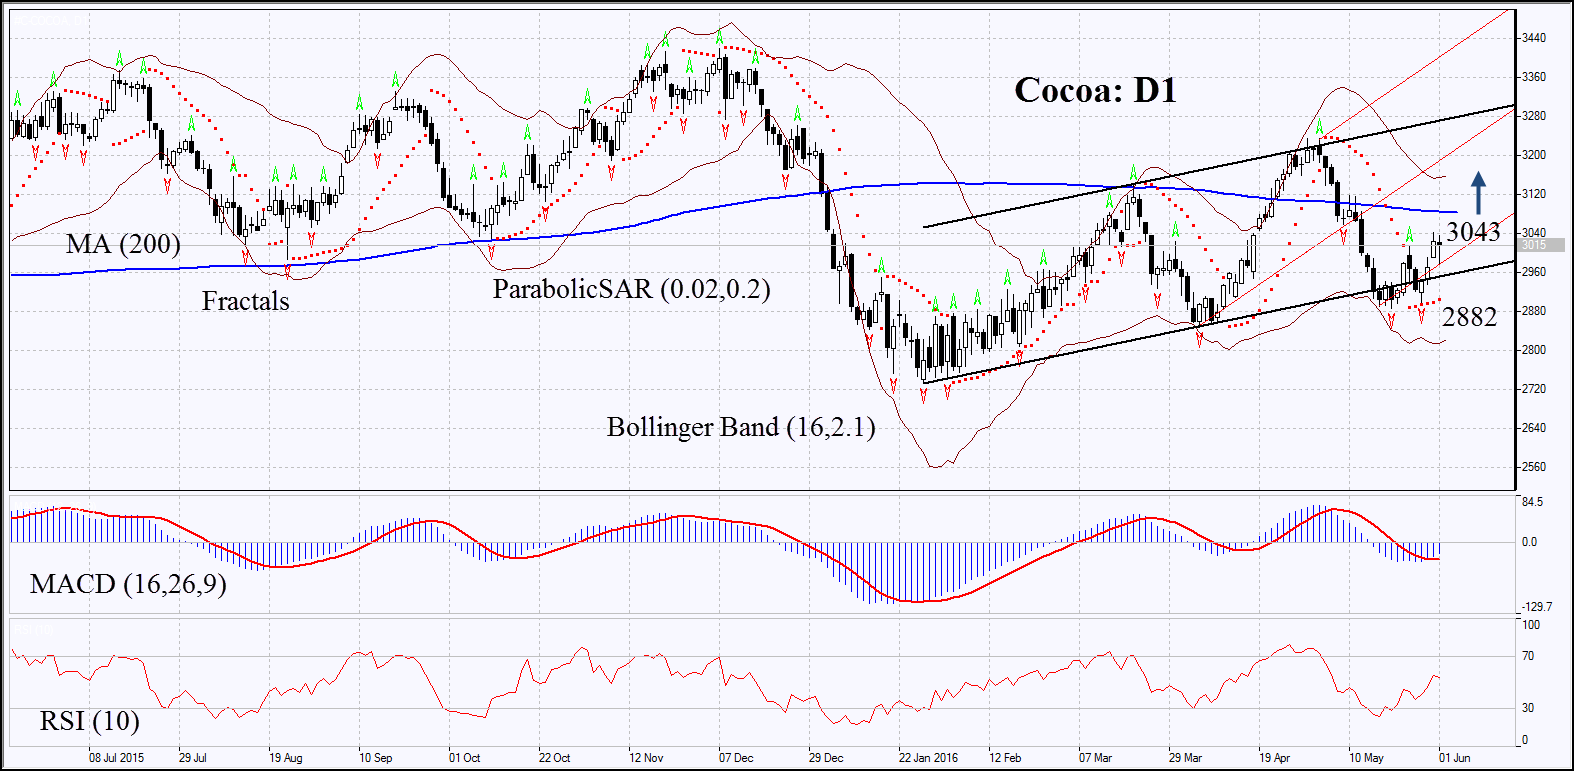
On the daily chart Cocoa: D1 broke down through the support of the rising trend. Now it is back to the trend which implies the break-through could have been false. The MACD and Parabolic indicators give signals to buy. The RSI is above 50, but has not yet reached the overbought zone. No divergence. The Bollinger bands have narrowed which means moderate volatility and are tilted upwards. The bullish momentum may develop in case the cocoa prices surpass the last daily high at 3043. This level may serve the point of entry. The initial stop-loss may be placed below the Parabolic signal and the two last fractal lows at 2882. Having opened the pending order we shall move the stop to the next fractal low following the Parabolic and Bollinger signals. Thus, we are changing the probable profit/loss ratio to the breakeven point. The most risk-averse traders may switch to the 4-hour chart after the trade and place there a stop-loss moving it in the direction of the trade. If the price meets the stop-loss level at 2882 without reaching the order at 3043, we recommend cancelling the position: the market sustains internal changes which were not taken into account.
| Position | Buy |
| Buy stop | above 3043 |
| Stop loss | below 2882 |
Market Analysis provided by IFCMarkets