By IFCMarkets
Wheat prices are edging up from the 5 and 1/2 year lows. Previously they lost 10% from mid-December amid favorable weather and stricter import regulations of grain to Egypt. Last week the weather has turned nasty which caused the massive closure of the shorts. For the last week of 2015 the volume of shorts closed increased almost 40%, according to the US Commodity Futures Trading Commission. Will the wheat prices continue rising?
Market participants have opened many shorts in wheat hoping for the continued spell of fine weather in the United States but it did not happen. The US Department of Agriculture (USDA) has revised downwards the winter wheat seedlings rated in “good and excellent” condition in Illinois on December 31 to 58% from 67% on November 29. Nine people died in flood in Illinois. The depreciated seedlings quality triggered the shorts closure and the further wheat prices growth. Now investors expect the report on global wheat market and the US stockpiles which are to be published on December 12, 2016 at 18:00 CET. Besides wheat the report will cover the corn, soy, cotton and rice markets. As follows from the consensus forecast, US wheat stockpiles on December 1 are estimated at 1.698 bn bushels. Investors do not expect the dramatic contraction of world wheat stockpiles by the end of 2015/16 season. They estimate them at 229.6mln tonnes while USDA estimated them at 22.86mln tonnes in its report last month.
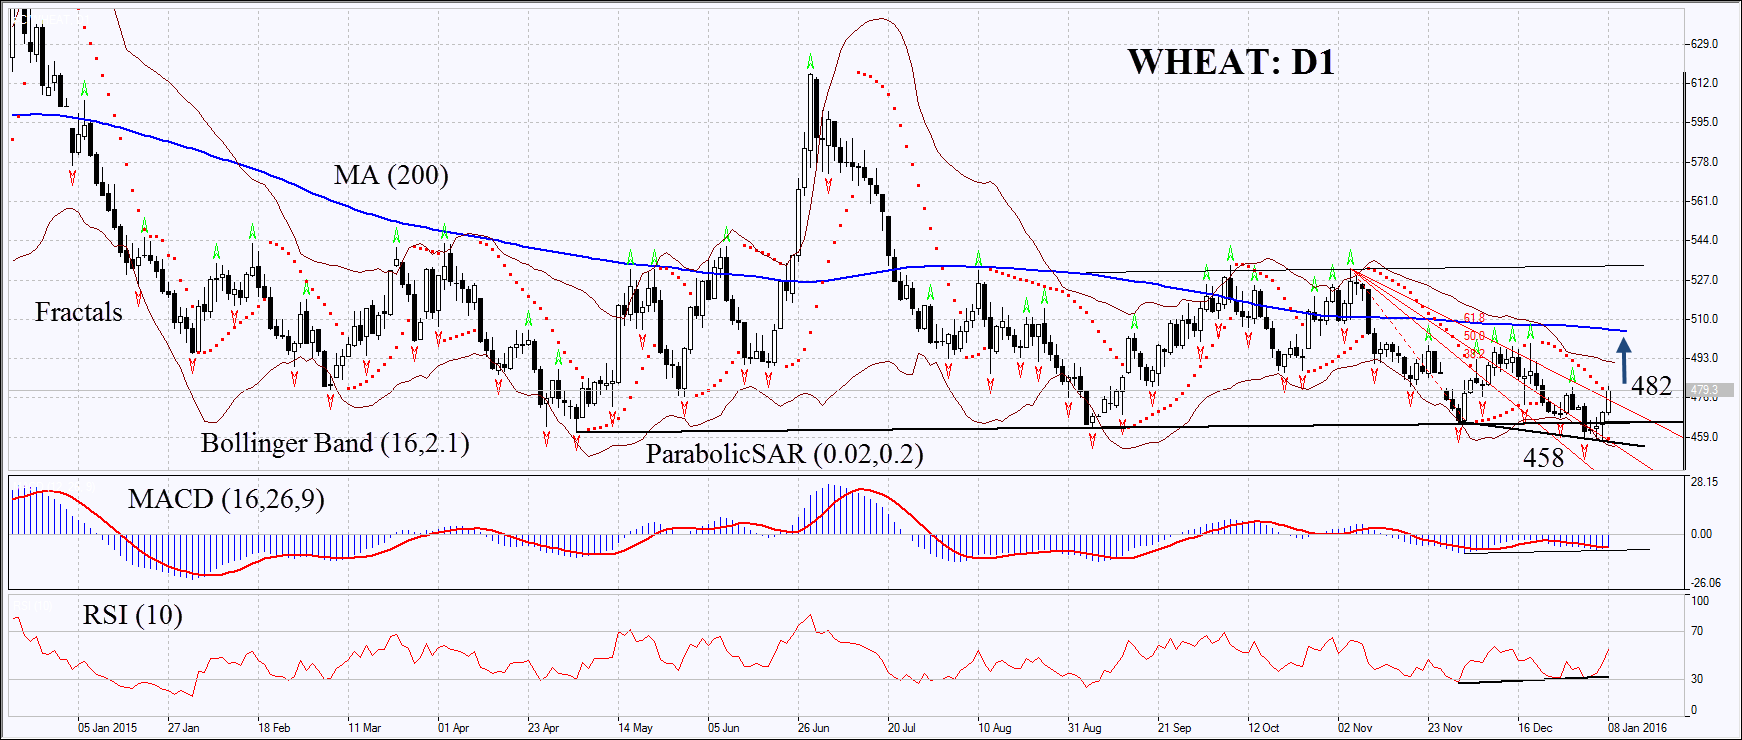
On the daily chart Wheat: D1 is moving sideways. A couple of days ago the attempt of breaking through its support failed but the wheat hit new record low since mid-2010. Now they are slightly moving upwards. The Parabolic indicator and MACD give buy signals. The Bollinger bands have contracted which may mean lower volatility. RSI has formed positive divergence. It has not yet reached the overbought zone but surpassed the level of 50. The bullish momentum may develop in case wheat prices surpass the last fractal high and the Parabolic signal at 482. This level may serve the point of entry. The initial risk-limit may be placed below the sideways trend support, the last fractal low, the 5 ½ year low and Parabolic signal at 458. Having opened the pending order we shall move the stop to the next fractal low following the Parabolic and Bollinger signals. Thus, we are changing the probable profit/loss ratio to the breakeven point. The most risk-averse traders may switch to the 4-hour chart after the trade and place there a stop-loss moving it in the direction of the trade. If the price meets the stop-loss level at 458 without reaching the order at 482, we recommend cancelling the position: the market sustains internal changes which were not taken into account.
| Position | Buy |
| Buy stop | above 482 |
| Stop loss | below 458 |
Market Analysis provided by IFCMarkets