By IFCMarkets
The mixed views on future oil prices
The oil prices are in the neutral trend after hitting a 6-year low three weeks ago and bouncing off of it. The important but mixed news are seen which may trigger the strong movement when the direction of the market is clear. So for what the oil prices will head?
The US investment bank Goldman Sachs revised down its forecast of the average WTI price for 2015 from $52 to $48,1 per barrel and for 2016 from $57 to $45. For Brent oil the forecast was revised down from $58,2 to $53,7 per barrel for 2015 and from $62 to $49,5 for 2016. In August and September more than 10 major banks have already revised down their outlook for the world oil prices. The current average Brent price is slightly below $58 since the start of the year so its further slump is expected till the end of the present year and in the beginning of the next one.
The International Energy Agency (IEA) holds the opposite view. It specifies no price ranges. Nevertheless, due to its forecast the low prices may cut the oil production in the non-OPEC countries (including the US) by 1 mln. barrels per day (b/d) next year. The slump in US oil production may total 0.4 mln b/d against its growth of 1.7 mln. b/d in 2014. At the same time, the IEA is expecting this year the record in 5 years growth of the world demand for oil by 1.7 mln b/d due to the low prices. In 2016 the demand may increase by the additional 1.4 mln. b/d. Such trends may cause the higher oil prices, according to several investors.
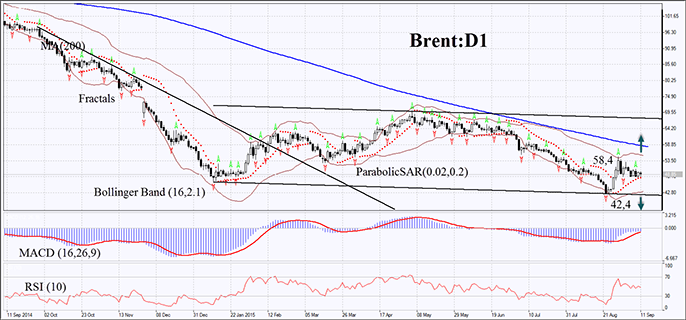
On the daily chart, the BRENT:D1 is in the neutral trend since the beginning of the year. Now the prices are struggling for growth bouncing off of the lower line. In our opinion, the pennant chart pattern is being formed on the daily timeframe. The price are below the 200-day moving average. The MACD and Parabolic indicators demonstrate signals to buy. The RSI is neutral being near 50. The Bollinger Bands have contracted which may mean the lower volatility. In our opinion, the momentum may appear after surpassing the level of the upper fractal and the Bollinger Band of 54.8 or in case of falling below the 6-year low, Parabolic signal and the lower Bollinger Band of 42.4. Let the market choose the direction. Two or more positions can be placed symmetrically: having opened one of the orders, the second can be cancelled as the market has chosen the direction. Having opened the delayed order we shall move the stop to the next fractal high (short position) and fractal low (long position) following the Parabolic signal every 4 hours. The most risk-averse traders may switch to the 4-hour chart after the trade and place there a stop-loss moving it in the direction of the trade. By doing this we adjust the potential profit/loss ratio in our favour. If the price meets the stop-loss level without reaching the order, we recommend cancelling the position: the market sustains internal changes which were not taken into account.
Free Reports:
 Get Our Free Metatrader 4 Indicators - Put Our Free MetaTrader 4 Custom Indicators on your charts when you join our Weekly Newsletter
 Get our Weekly Commitment of Traders Reports - See where the biggest traders (Hedge Funds and Commercial Hedgers) are positioned in the futures markets on a weekly basis.
| Position | Sell |
| Sell stop | below 42,4 |
| Stop loss | above 54,8 |
| Position | Buy |
| Buy stop | above 54,8 |
| Stop loss | below 42,4 |
Market Analysis provided by IFCMarkets