By IFCMarkets
Core Retail Sales
Today at 14:30 CET two key indicators of the US economy are to be released: Core Retail Sales and Unemployment Claims. The first indicator is released monthly by the US Census Bureau and, therefore, it is of interest for position trading. CRS shows a relative change in the total value of sales at the retail level, excluding automobiles, which account for 20% of the total volume. The index defines the consumer confidence. Less important indicator, Initial Claims, is projected on the basis of previous NonFarm performance. The data is published weekly by the Ministry of Labor. The indicator allows evaluating the domestic demand dynamics and the potential of consumer lending for the US economy stimulation. We assume that the release of both indicators would result in significant volatility of the US dollar against the most liquid instruments.

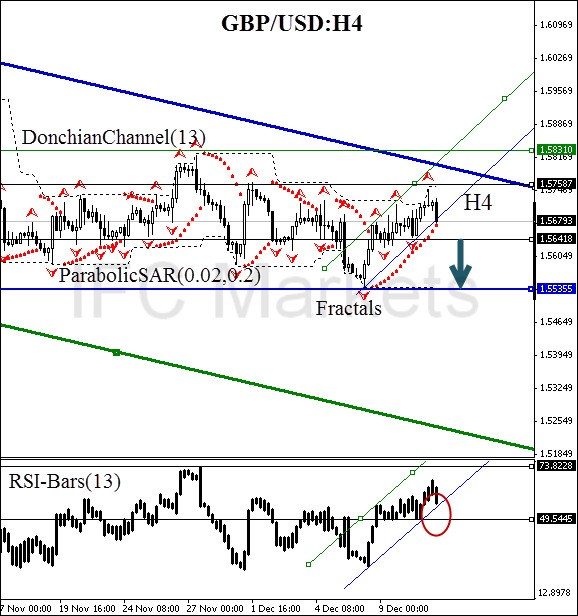
Here we consider GBP/USD currency pair on the H4 chart. The price is moving sideways, which is expected to finish with the support breakout at 1.56418 in the D1 trend direction. It occurs at the same time with the Parabolic downside reversal and the Donchian Channel bias change. Conservative traders are also recommended to get a confirmatory signal on the part of the RSI-Bars oscillator. At the moment, the oscillator line has approached the local resistance level at 73.8228% and is ready for reversal. The completion of bullish trend should be expected after the breakout at 49.5445%. Partially, Take profit may be possibly placed at 1.55355. Stop Loss is better to be placed at the fractal resistance 1.57587. This mark is confirmed by the upper Donchian Channel boundary.

Currently, the volume of futures and options traded on the Chicago Mercantile Exchange has increased significantly up to 180 000 contracts and even higher. You can monitor this data by clicking here. This indicates high liquidity of the currency ahead of a new volatility momentum. The probability of false breakouts in such conditions is low.
After position opening, Stop Loss is to be moved after the Parabolic values, near the next fractal high. Updating is enough to be done every day after a new Bill Williams fractal formation (5 candlesticks). Thus, we are changing the probable profit/loss ratio to the breakeven point.
Free Reports:
 Get Our Free Metatrader 4 Indicators - Put Our Free MetaTrader 4 Custom Indicators on your charts when you join our Weekly Newsletter
 Get our Weekly Commitment of Traders Reports - See where the biggest traders (Hedge Funds and Commercial Hedgers) are positioned in the futures markets on a weekly basis.
| Position | Sell |
| Sell stop | below 1.56418 |
| Stop loss | above 1.57587 |
Dear traders. For the detailed report of the strategy based on analytical issues of technical analysis click here.
Market Analysis provided by IFCMarkets