By IFCMarkets
Good afternoon, dear investors. Yesterday, the North Atlantic Treaty Organization (NATO) published the satellite imagery confirming the invasion of Ukraine territory by Russian military equipment on its official website. Heads of State and Government of the European Union will held a Special Summit on Ukraine situation and the possibility of expanding sanctions on Russia on Saturday, August 30. It is possible that the discussion will be focused on widening the energy sector sanctions, since some single interventions have been exhausted. Note that the EU accounts for not less than 60% of Russian foreign investment. However, the EU share in Russian foreign trade amounted to 49.4% in 2013. A wide range of new sanctions being imposed will result in further losses of the European markets, and potential reduction of Russian investments. After the introduction of food embargo, there is no need to hope that any economic pressure on Russia would not receive a reply. Therefore, we assume that the conflict aggravation in such a manner has a high probability to cause a temporary decline in European stock markets. A further freezing of trade relations with Russia will lead to a drop in demand for European currencies and, as a consequence, their further weakening. In this situation, European investors prefer to seek assistance of defensive assets, such as gold and silver. Thus, in the last 13 days the correlation between the German DAX and gold (XAUUSD) amounted to 80%: the index fall leads to an increase in demand for the precious metal.
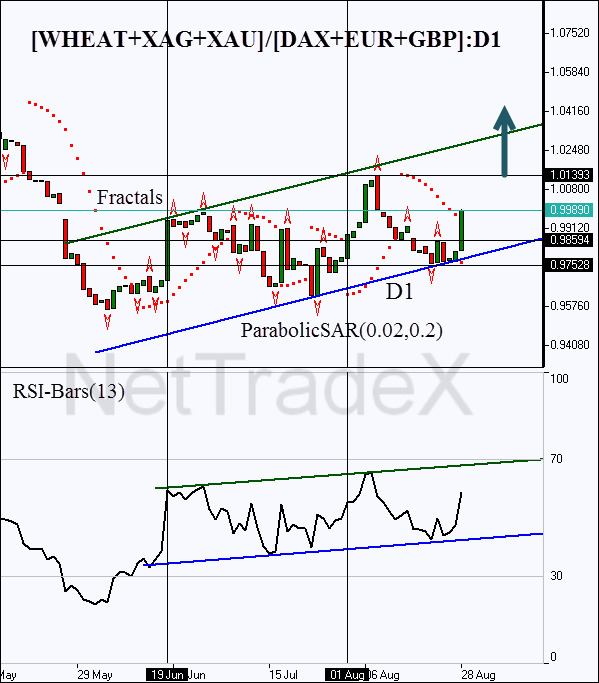
In order to show the market reaction on the conflict aggravation, we have built a paired spread instrument in NetTradeX platform using the GeWorko model:
[WHEAT+XAG+XAU]/[DAX+EUR+GBP]. The composite instrument is based on quoting of defensive assets, i.e. gold and silver against European assets – the German stock index DAX and European currencies. An agricultural wheat future is included in the spread basic part. Let us remind you that Ukraine takes the 6th place in the ranking of the world exports volume, and the conflict aggravation leads to a fretted market of agricultural products. As a consequence, the demand is growing: the suppliers are trying to limit the risks by a sharp inventory increase.
Let us note that the price of each of the assets in the instrument is calculated automatically in US dollars by the program. The price of a paired instrument is expressed by the ratio of the underlying portfolio value of WHEAT(33%)+XAG(33%)+XAU(33%) to the quoted portfolio value DAX(33%)+EUR(33%)+GBP(33%). The proportion of funds invested in each portfolio asset is equal to 33%. The purchasing of synthetic spread instrument is identical to purchasing of the underlying portfolio and the simultaneous selling of the quoted portfolio based on the currency cross-rate model. Note that the portfolio quoting allows us to diversify the short position risks, and at the same time to increase the reaction intensity of the instrument on political events.

Let us make use of the situation for a profitable investment in this instrument. The daily chart of the portfolio spread was built in NetTradeX. For calculation acceleration only the opening and closing prices of daily candlesticks are being used. We can see that the expansion of the anti-terrorist operation in early August led to a new uptrend formation. The next key level for the pending buy order to be placed is at 1.01393. At its intersection we can talk about the continuation of the daily bullish trend. The general price direction is confirmed by ParabolicSAR and RSI oscillator. It is reasonable to limit the risks at 0.97528, which is strengthened by the trend line and Bill Williams fractal.
After position opening, Trailing Stop is to be moved after the ParabolicSAR values, near the next fractal trough – the trend following strategy. Thus, we are changing the probable profit/loss ratio to the breakeven point.
Free Reports:
 Get Our Free Metatrader 4 Indicators - Put Our Free MetaTrader 4 Custom Indicators on your charts when you join our Weekly Newsletter
 Get our Weekly Commitment of Traders Reports - See where the biggest traders (Hedge Funds and Commercial Hedgers) are positioned in the futures markets on a weekly basis.
| Direction | up |
| Buy stop | above 1.01393 |
| Stop loss | below 0.97528 |
For more information about the portfolio operations, you can read on our website “Quick Guide for Creating and Trading PCI”.
Market Analysis provided by IFCMarkets