By IFCMarkets
Good afternoon, dear traders. The key event of this afternoon is the release of two basic indicators of the U.S. domestic demand: Unemployment Claims (14:30 CET) and New Home Sales (16:00 CET). The first indicator is calculated on the weekly data basis, which is collected by the U.S. Department of Labor and published in a weekly report. Unemployment Claims indicator allows estimating the domestic demand dynamics, as well as the consumer lending capacity to stimulate the U.S. economy. The United States Census Bureau publishes New Home Sales statistics monthly. The indicator shows the number of new housing sold per 1 family. It is considered to be the leading indicator of economic development as it has a multiplicative effect on various economic sectors: mortgages, insurance contributions, furniture, electronics, etc. Besides New Home Sales is determined by a larger statistics volume than Unemployment Claims. For that reason it is necessary to pay attention on the U.S. currency market when this particular indicator is released. The data is analyzed by long-term investors with utmost care, and accordingly it may affect the strengthening or weakening of the U.S. currency.

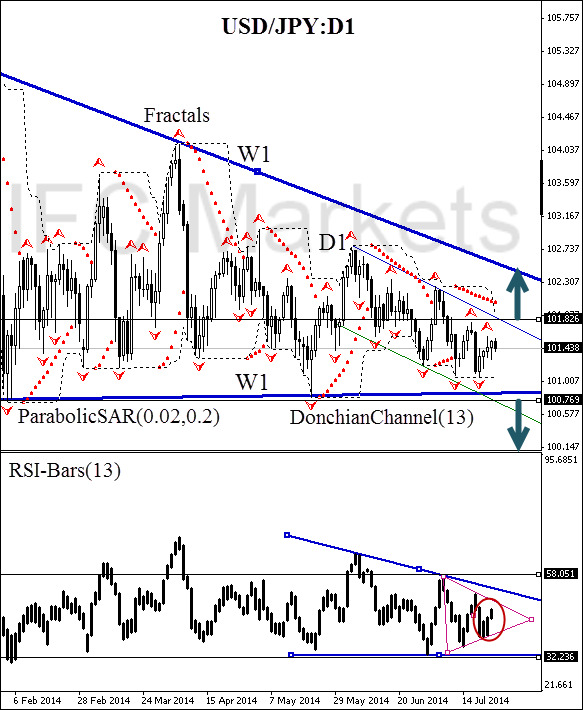
Here we consider the USD/JPY behavior on the daily chart. The price is located within the consolidation area, limited by the “bearish” triangle: the upper side is formed by weekly downtrend line. RSI-Bars confirm the graphic figure; an equilateral triangle is formed on the H4 scale. The market acquires energy for a new highly volatile phase. Pending sell order might be placed below the fractal support 100.769, which is confirmed by DonchianChannel historical values. The oscillator signal will help us to be sure that the breach is not false. At that moment a simultaneous indicator level crossing is expected at 32.236 and its leaving the consolidation area. A conservative position defense can be generated based on fractal resistance at 101.826. It is confirmed by the 30-day DonchianChannel upper border, as well as by D1 bearish trend line. Stop Loss is recommended to be placed at this particular mark.
After position opening, Trailing Stop is to be moved after the ParabolicSAR values, or near the next fractal peak. Thus, we are changing the probable profit/loss ratio to the breakeven point.
| Direction | down |
| Sell stop | below100.769 |
| Stop loss | above 101.826 |
Market Analysis provided by IFCMarkets