By Dmitriy Gurkovskiy, Chief Analyst at RoboForex
On Monday, July 13th, Brent is falling and trading at $42.93. Basically, if one remembers the oil price this spring, the current value is quite stable. However, market players can’t be sure in anything, neither the oil price surge amid the increasing demand, nor the lack of demand and, as a result, predictable oil sales.
The latest data from Baker Hughes showed that the number of oil rigs in the United States fell again and on July 10th, was equal to 181 units. And now just feel the difference – at the same period of time last year, the reading was 784 units. The total rig count in the country is 258 units.
Early in the week, financial markets are anticipated to be pretty quiet but getting more and more dynamic as the trading week unfolds. For example, market players will closely follow the US comments relating to a possible resumption of trade talks with China because any negative news here may quickly become a reason for oil investors to sell the “black gold”.
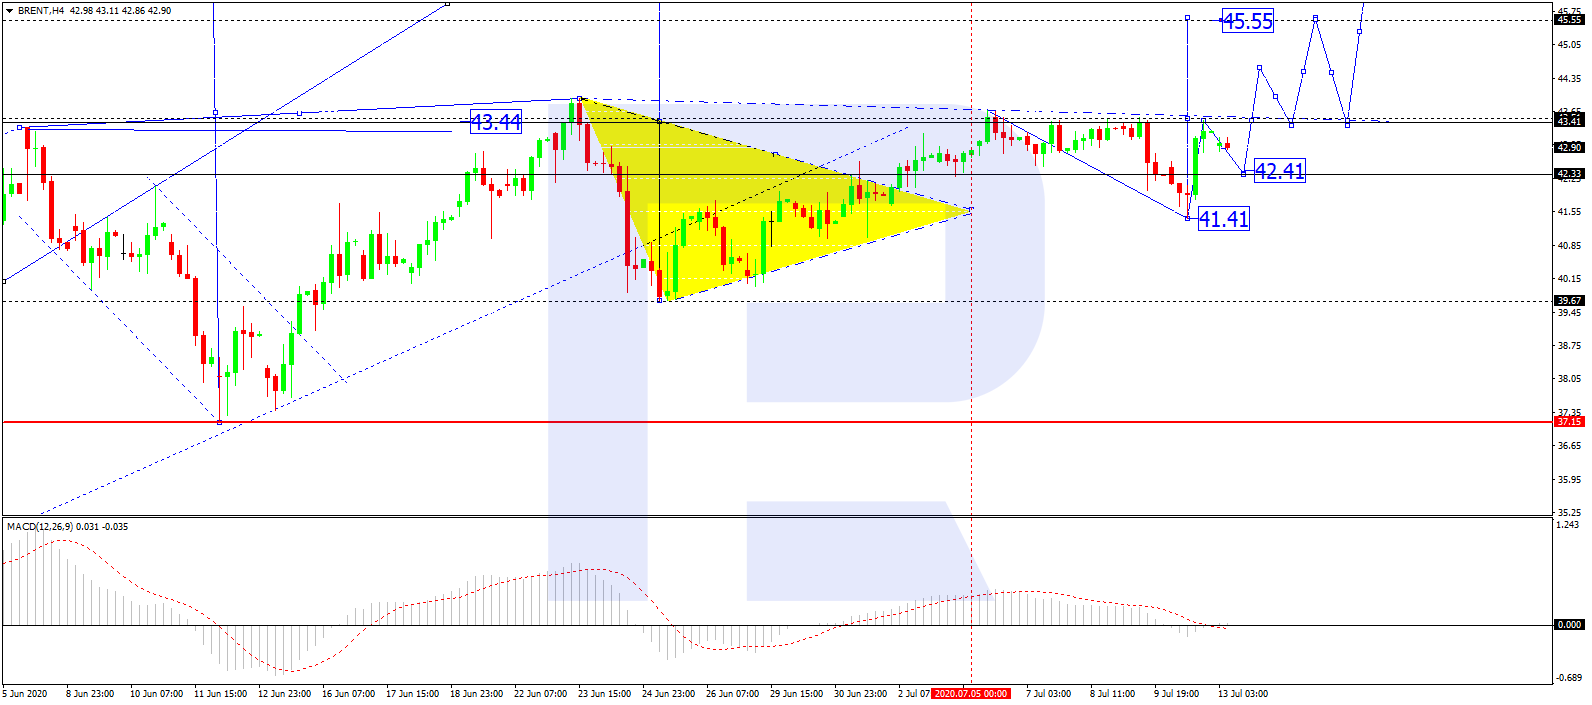
In the H4 chart, after finishing the correction at 41.41, Brent is forming a new ascending impulse towards 43.50. After reaching this level, the instrument may start another correction. However, if the price breaks 43.50 to the upside, the pair may continue trading upwards with the short-term target at 45.55. From the technical point of view, this scenario is confirmed by MACD Oscillator: its signal line is moving close to 0. Later, the line is expected to rebound from 0 and resume moving upwards.
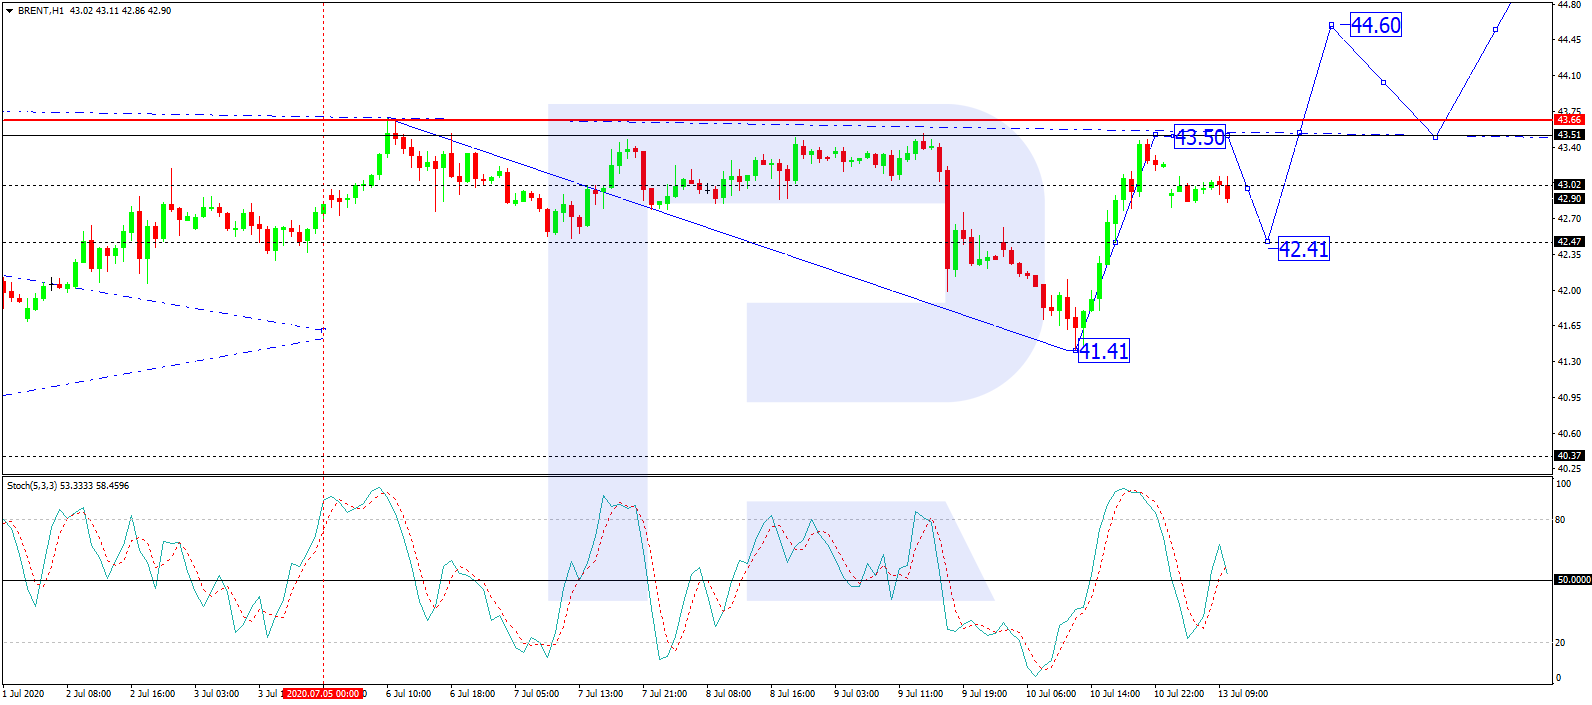
As we can see in the H1 chart, Brent is consolidating around 43.00. Today, the pair may fall to expand the range down to 42.42 and complete the correction. After that, the instrument may start a new growth to reach 43.50. From the technical point of view, this idea is confirmed by Stochastic Oscillator: its signal line has broken 80; right now, it is moving near 50 and may continue falling to reach 20, thus implying a possible decline towards 42.42 on the price chart. Later, when the indicator resumes growing towards 80, the price chart may resume trading upwards as well and reach 43.50.
Free Reports:
 Get Our Free Metatrader 4 Indicators - Put Our Free MetaTrader 4 Custom Indicators on your charts when you join our Weekly Newsletter
 Get our Weekly Commitment of Traders Reports - See where the biggest traders (Hedge Funds and Commercial Hedgers) are positioned in the futures markets on a weekly basis.
Disclaimer
Any predictions contained herein are based on the author’s particular opinion. This analysis shall not be treated as trading advice. RoboForex shall not be held liable for the results of the trades arising from relying upon trading recommendations and reviews contained herein.

