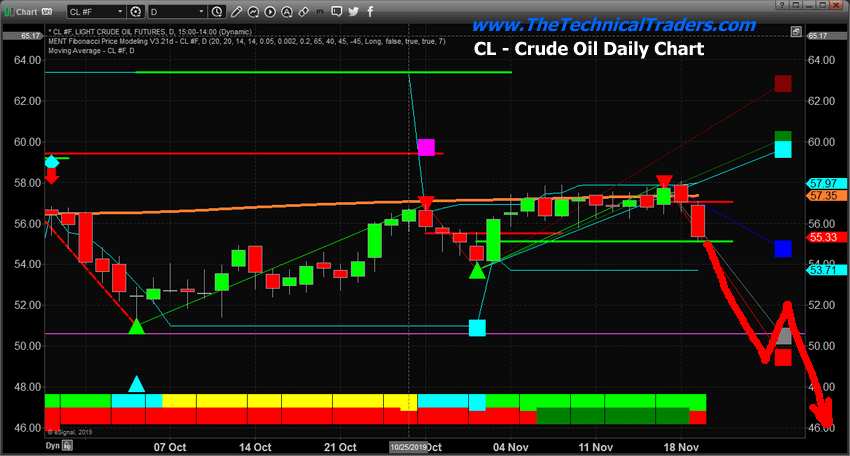
Recently, we posted a multi-part research post suggesting a collapse in Crude Oil could be setting up and how we believe this decline in energy prices may lead to a broader market collapse in the near future. Crude oil fell more than 3% on November 19 in what appears to be a major price reversal. On November 20, inventory levels and other key economic data will be presented – could the price of oil collapse even further over the next 60+ days?
Here is a link to our most recent multi-part article about Crude Oil from November 13 (just a week ago): https://www.thetechnicaltraders.com/what-happens-to-the-global-economy-if-oil-collapses-below-40-part-i/
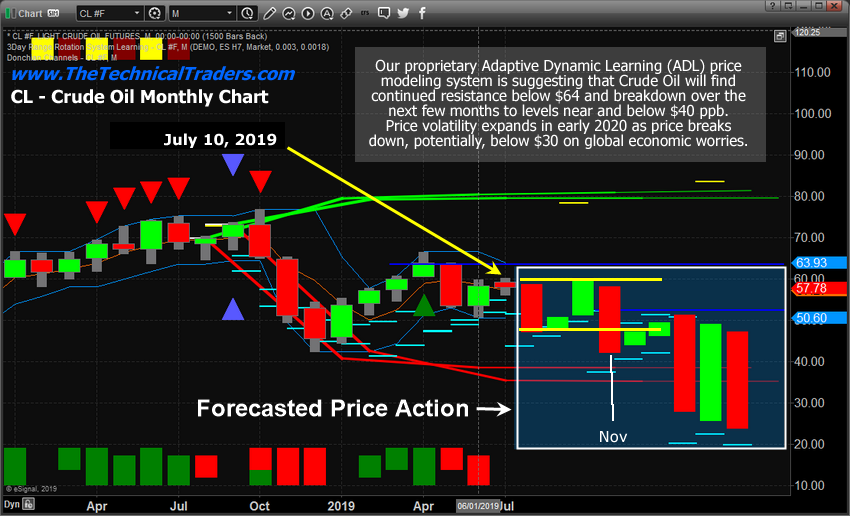
Our original research chart from July 2019
Our original research post, from July 2019, included this chart showing our Adaptive Dynamic Learning (ADL) price modeling system and where it believed the price of oil would go in the future. This chart highlights expected price ranges and directions all the way into April 2020 with a low price level near $25 somewhere between February and April 2020. Is Oil really going to reach a low price near $25 ppb in the near future?
On July 10, 2019, we authored a research article using our ADL predictive modeling for Oil. At that time, we predicted Oil would fall in August, recover in September and October, then collapse to near $42 (or lower) in November and December. You can read our followup to this article here.
In order for these predictions to continue to hold true, Crude Oil will have to fall below $47 ppb over the next 30+ days and then consolidate through December and January into a fairly tight price range between $42 and $49. If this happens as we predicted back in July, then there would be a much higher probability that the February, March and April price targets are valid going forward.
Free Reports:
 Get Our Free Metatrader 4 Indicators - Put Our Free MetaTrader 4 Custom Indicators on your charts when you join our Weekly Newsletter
 Get our Weekly Commitment of Traders Reports - See where the biggest traders (Hedge Funds and Commercial Hedgers) are positioned in the futures markets on a weekly basis.
On November 19, Crude oil reversed quite extensively to the downside after weeks of upward price pressure. We believe this downside price rotation may be setting up a bigger, deeper price move that is aligned with our ADL predictive modeling systems results from July 2019 – eventually targeting the sub $50 price level near the end of November or early December. You can get all of my trade ideas by opting into my free market trend signals newsletter.
Concluding Thoughts:
This potential move in Crude Oil is setting up a potentially great trade for active traders if you know how to profit from falling prices and I even talked about how to trade this move in my member’s only trading newsletter service. Remember, if our ADL research is correct, December and January will see very mild price action in Oil. The bigger breakdown move happens in late January or early February.
On Monday another commodity gave us another trade and it popped 3.4% in our favor within the first trading session. Big moves in stocks, metals, and energy are ready for big price swings here, get ready!
As a trader, you need to be aware of the greater implications for the global markets if Crude Oil falls below $45 ppb (eventually, possibly falling below $30 ppb). A large portion of the global market depends on oil prices being relatively stable above $50 ppb. A decrease in oil prices will place extreme pressures on certain nations to maintain oil production and to generate essential revenues. Depending on how this plays out in the future, falling oil prices could translate into far greater risks for the global stock markets and global economics.
Chris Vermeulen – TheTechnicalTraders.com

