By IFCMarkets
Dollar weakening accelerated despite yuan decline
US stock indexes losses widened on Monday as China’s yuan fell to a more-than-10-year low versus the dollar. The S&P 500 fell 3% to 2844.74. Dow Jones industrial lost 2.9% to 25717.74. The Nasdaq composite dropped 3.5% to 7726.04. The pace of dollar weakening more than doubled: the live dollar index data show the ICE US Dollar index, a measure of the dollar’s strength against a basket of six rival currencies, fell 0.7% to 97.40 but is higher currently. Stock index futures point to higher market openings today
DAX 30 loss smallest among European indexes
European stocks extended losses on Monday. The EUR/USD climb accelerated yesterday while GBP/USD resumed its slide, both have reversed currently. The Stoxx Europe 600 index ended 2.3% lower. The DAX 30 lost 1.8% to 12658.51. France’s CAC 40 slid 2.2% and UK’s FTSE 100 dropped 2.5% to 7223.85.
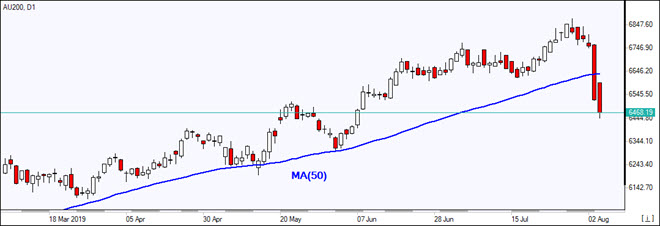
Hang Seng still loss leader among Asian indexes
Asian stock indices are tracking today Wall Street losses overnight. Nikkei closed 0.7% lower at 20585.31 despite the yen slide against the dollar. Markets in China are falling as yuan steadied and Beijing confirmed it was suspending purchases of US agricultural products: the Shanghai Composite Index is down 1.8% and Hong Kong’s Hang Seng Index is 1.3% lower. Australia’s All Ordinaries Index deepened previous session losses 2.4% as Australian dollar turned higher against the greenback.
Brent rising
Brent futures prices are edging higher today. Prices fell yesterday: October Brent crude closed at $59.81 a barrel on Monday.
Market Analysis provided by IFCMarkets
Free Reports:
 Get Our Free Metatrader 4 Indicators - Put Our Free MetaTrader 4 Custom Indicators on your charts when you join our Weekly Newsletter
 Get our Weekly Commitment of Traders Reports - See where the biggest traders (Hedge Funds and Commercial Hedgers) are positioned in the futures markets on a weekly basis.
Note:
This overview has an informative and tutorial character and is published for free. All the data, included in the overview, are received from public sources, recognized as more or less reliable. Moreover, there is no guarantee that the indicated information is full and precise. Overviews are not updated. The whole information in each overview, including opinion, indicators, charts and anything else, is provided only for familiarization purposes and is not financial advice or а recommendation. The whole text and its any part, as well as the charts cannot be considered as an offer to make a deal with any asset. IFC Markets and its employees under any circumstances are not liable for any action taken by someone else during or after reading the overview.