By IFCMarkets
Boeing production cut bearish for United Technology stock
United Technology sales suffer from Boeing production cut of Boeing 737 Max. Will the United Technology stock price continue declining?
United Technologies Corporation is an American multinational conglomerate with sales of $66.5 billion in 2018, up 11% over prior year. Over the weekend the company announced plans to merge with defense major Raytheon. Earlier in December it announced plans to break up into one company owning Otis elevators, another making Carrier air conditioners, and a third producing engines for F-35 fighter jets. Merging the areo-space unit with Raytheon will create a mega aerospace and defense company with $63 billion in annual sales, second only to Boeing. Proponents of such a merger estimate it could yield cost savings of as much as $1 billion a year. And the price-to-sales (P/S) ratio of the new company is forecast to be about 1.6 — cheaper than Boeing’s 2.0 P/S ratio, cheaper than the 1.9 times sales that Raytheon stock costs right now, and about the same as UTC’s current 1.6-times-sales valuation.
However, President Trump sounded not much in favor of such a merger, commenting “I’m a little concerned about United Technologies and Raytheon.” Shares of United Technologies fell 3.1% after the company announced the all-stock deal. In the first-quarter earnings report the company warned earnings may decline this year with the Boeing 737 Max on hold. While earnings climbed to $1.91 a share in the first quarter, United Technologies forecast the Boeing 737 Max groundings could shave as much as 10 cents off earnings per share this year, if the airplane maker maintains a sharp production cut through year-end. Extended Boeing production cut is negative risk for United Technology stock price.

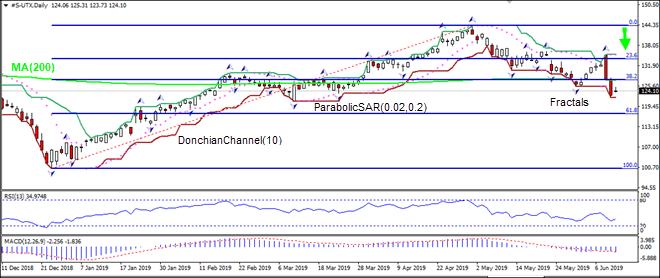
On the daily timeframe the S-UTX: D1 has closed below the 200-day moving average MA(200) and Fibonacci 38.2. This is bearish.
- The Parabolic indicator has formed a sell signal.
- The Donchian channel indicates no trend: it is flat.
- The MACD indicator gives a bearish signal: it is below the signal line and the gap is widening.
- The RSI oscillator is rising but is far from reaching the overbought zone.
We believe the bearish momentum will continue after the price breaches below the lower boundary of Donchian channel at 122.13. This level can be used as an entry point for placing a pending order to sell. The stop loss can be placed above the fractal high at 135.24. After placing the order, the stop loss is to be moved every day to the next fractal high, following Parabolic signals. Thus, we are changing the expected profit/loss ratio to the breakeven point. If the price meets the stop loss level (135.24) without reaching the order (122.13), we recommend cancelling the order: the market has undergone internal changes which were not taken into account.
Technical Analysis Summary
| Order | Sell |
| Sell stop | Below 122.13 |
| Stop loss | Above 135.24 |
Market Analysis provided by IFCMarkets
Free Reports:
 Get Our Free Metatrader 4 Indicators - Put Our Free MetaTrader 4 Custom Indicators on your charts when you join our Weekly Newsletter
 Get our Weekly Commitment of Traders Reports - See where the biggest traders (Hedge Funds and Commercial Hedgers) are positioned in the futures markets on a weekly basis.