By IFCMarkets
Preparing for the meeting of the Bank of Mexico
In this review, we suggest considering the personal composite instrument (PCI) “Silver vs. MXN”. It reflects the price dynamics of silver against the Mexican peso. Will the XAGMXN rise?
Such dynamics indicate an increase in silver prices and the weakening of the Mexican peso. Precious metals were in demand last week. Gold prices added 1% and platinum prices – 2%. Against their background, silver is still lagging behind and its prices have increased by only 0.3% over the past week. The main factors for the increased demand for precious metals are the high risks of a slowdown in the global economy. In particular, this was stated by the US Federal Reserve, which noted that most likely there would not be a rate hike in 2019. US GDP growth in 2019 may slow down to 2.1% from 3% in 2018. Precious metals may become heaven assets in case of global economic problems. It may be noted that weak macroeconomic data came out in China and Germany as well. The weakening of the peso may occur in case of a rate cut by the Bank of Mexico at the next meeting on March 28 to 8% from 8.25%. Mexican inflation in February and March of the current year fell below 4% for the first time since December 2016.

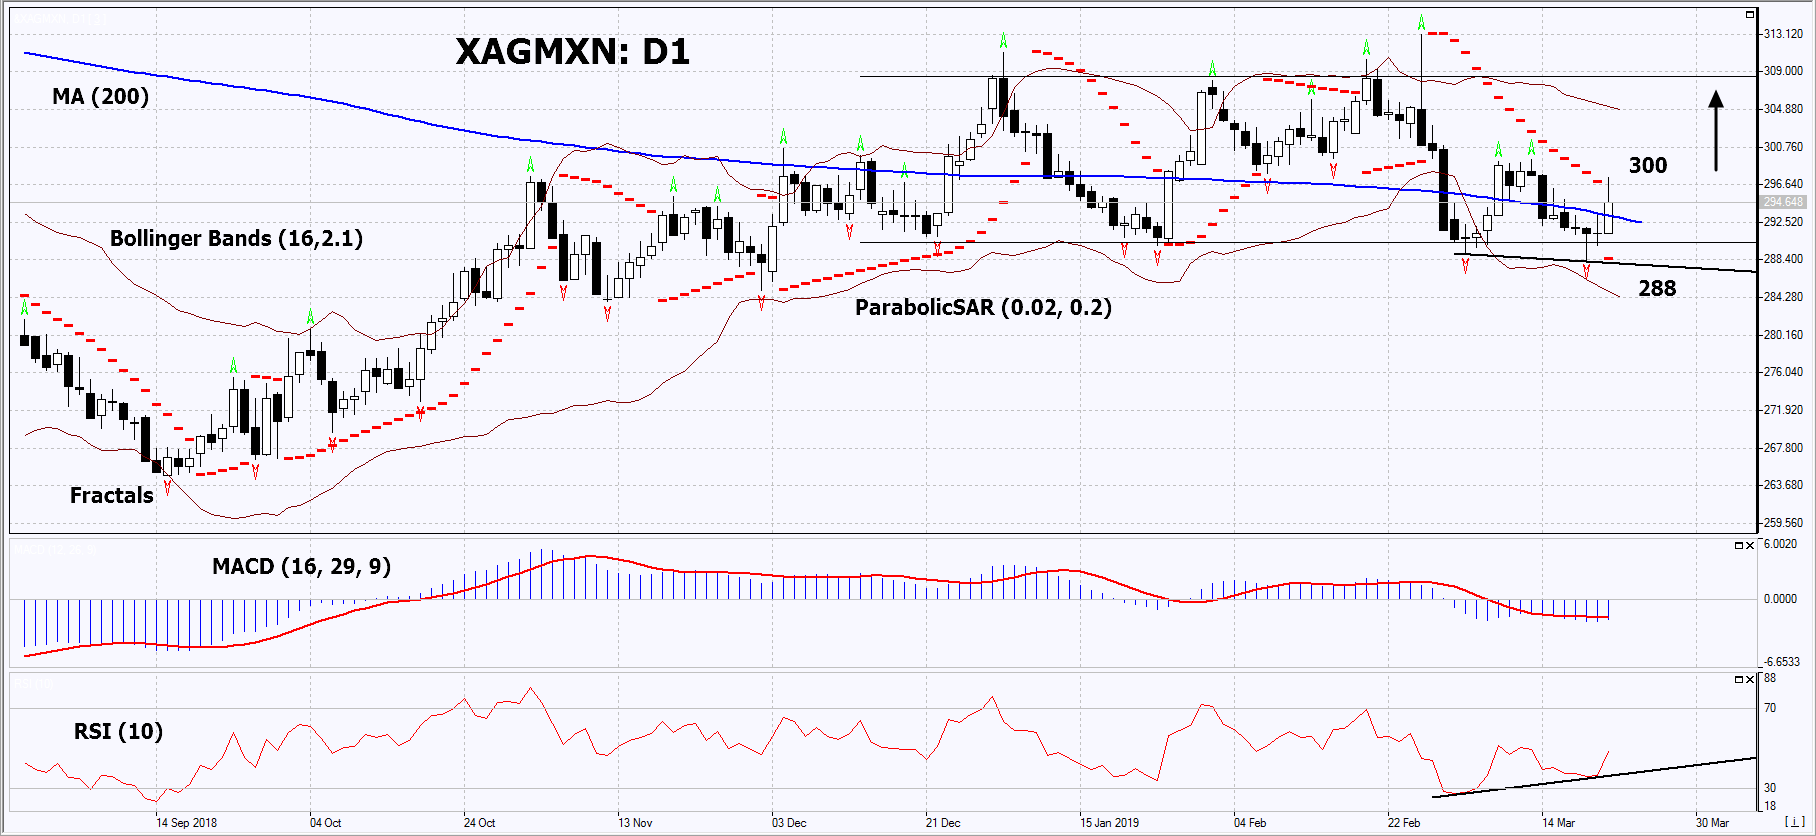
On the daily timeframe, XAGMXN: D1 could not breach down the lower line of the neutral range for the 4th time. Theoretically, it can move to its upper boundary. Most technical analysis indicators formed buy signals. The further price increase is possible if high demand for precious metals preserves and the Bank of Mexico cuts the rate.
- The Parabolic Indicator gives a bullish signal.
- The Bollinger bands have widened, which indicates high volatility. Both Bollinger bands are titled down, but such a signal may not work in a neutral range.
- The RSI indicator is below 50. It has formed a positive divergence.
- The MACD indicator gives a bullish signal.
The bullish momentum may develop in case XAGMXN exceeds its two last fractal highs at 300. This level may serve as an entry point. The initial stop loss may be placed below the two last fractal lows, the lower liner of the neutral range and the Parabolic signal at 288. After opening the pending order, we shall move the stop to the next fractal low following the Bollinger and Parabolic signals. Thus, we are changing the potential profit/loss to the breakeven point. More risk-averse traders may switch to the 4-hour chart after the trade and place there a stop loss moving it in the direction of the trade. If the price meets the stop level (288) without reaching the order (300), we recommend to close the position: the market sustains internal changes that were not taken into account.
Summary of technical analysis
| Position | Buy |
| Buy stop | Above 300 |
| Stop loss | Below 288 |
Market Analysis provided by IFCMarkets
Free Reports:
 Get Our Free Metatrader 4 Indicators - Put Our Free MetaTrader 4 Custom Indicators on your charts when you join our Weekly Newsletter
 Get our Weekly Commitment of Traders Reports - See where the biggest traders (Hedge Funds and Commercial Hedgers) are positioned in the futures markets on a weekly basis.