By Money Metals News Service
Sales of Silver Eagles continue to be strong as demand for the official coins surged in February. Moreover, as the Authorized purchases of Silver Eagles jumped by 775,000 oz this past Thursday, the U.S. Mint issued a temporary suspension of sales until inventories can be restocked. This is a very positive sign as total Silver Eagle sales last year fell to low of 15.7 million, down more than 50%, compared to the 37.7 million set in 2016.
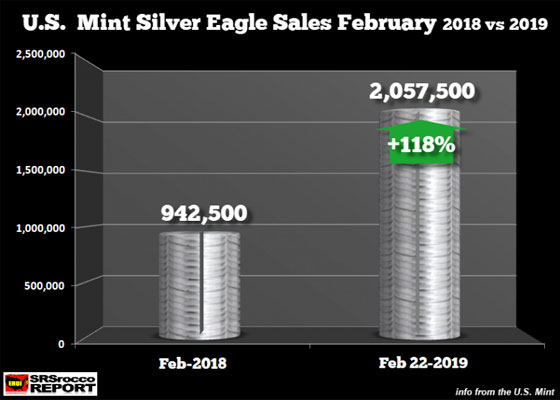
According to the U.S. Mint’s most recent update, Silver Eagle sales as of February 21st were 2,057,500 versus the 942,500 during the same month in 2018. Not only are Silver Eagle sales this month more than double last year, but they also surpassed Feb 2017’s figure by 842,000 oz:

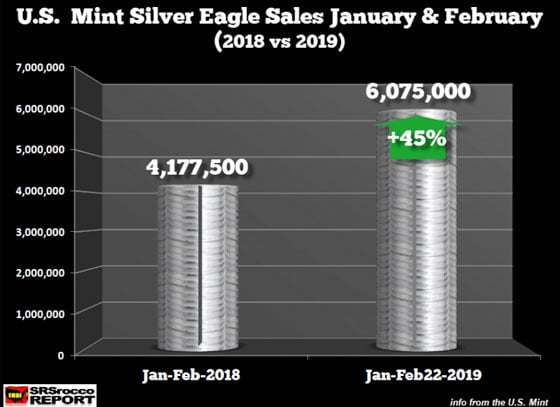
Furthermore, Silver Eagle sales JAN-FEB 2019 are 6,075,000 compared to 4,177,500 sold during the same period last year. Thus, sales of Silver Eagles are up 45% versus the first two months in 2018:

I believe demand for Silver Eagles will remain strong this year, but it will take another financial and economic crisis to push the annual purchases back up to the 35-40+ million range. And, I believe we may likely see that type of demand in the next few years as the global financial system starts to unwind due to the massive amount of unsustainable debt.
Interestingly, the Silver to Gold Eagle sales ratio this year is nearly 80/1 compared to the 70/1 during the same period in 2018.
Free Reports:
 Get Our Free Metatrader 4 Indicators - Put Our Free MetaTrader 4 Custom Indicators on your charts when you join our Weekly Newsletter
 Get our Weekly Commitment of Traders Reports - See where the biggest traders (Hedge Funds and Commercial Hedgers) are positioned in the futures markets on a weekly basis.
Silver Eagle Sales JAN-FEB 2018 = 4,177,500
Gold Eagle Sales JAN-FEB 2018 = 59,000 oz
Silver-Gold Eagle Ratio JAN-FEB 2018 = 70/1
Silver Eagle Sales JAN-FEB 2019 = 6,075,000
Gold Eagle Sales JAN-Feb 2019 = 77,000
Silver-Gold Eagle Ratio JAN-FEB 2019 = 79/1
It seems as if the Authorized Dealers and investors are taking advantage of the higher Gold-Silver price ratio of 83/1 in February versus the average of 81/1 in January. Savvy investors tend to buy more silver when the Gold-Silver ratio is high and more gold when the opposite is true.
Lastly, the annual record for Gold Eagle sales was 2,055,500 oz set in 1999, due to the Y2K scare. Although, the last peak of Gold Eagles occurred during the financial crisis in 2009 at 1,435,000 oz. Now compare that to the total 245,500 oz of Gold Eagles sold in 2018. However, the largest yearly demand for Silver Eagles took place in 2015 at a stunning 47,000,000.
Unfortunately, as we can see, investors have severely cut back on Silver, and Gold Eagle purchases as the Wall Street Casino has attracted most of the markets’ funds. While it has been a long and frustrating road for precious metals investors, I can assure you; we will have the last laugh.
 The Money Metals News Service provides market news and crisp commentary for investors following the precious metals markets.