By IFCMarkets
Stronger French data bullish for FR40
Expansion in French manufacturing sector accelerated in July. Will the FR 40 continue rising?
Latest French economic reports were positive: the manufacturing purchasing managers’ index reported by Markit rose to 53.3 in July from 52.5 in June, indicating acceleration of economic activities in July after the second quarter GDP remained steady at 0.2% over quarter. At the same time French inflation in July climbed to 2.3% annual rate from 2% in the previous month. Improving economic data are bullish for French stock index FR 40.
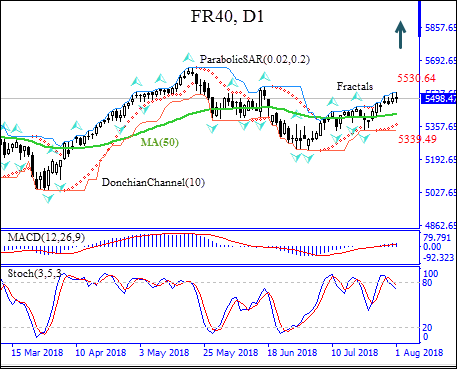
On the daily timeframe the FR40: D1 is abpve the 50-day moving average MA(50) which is rising, this is bullish.
- The Parabolic indicator gives a buy signal.
- The Donchian channel indicates uptrend: it is tilted up.
- The MACD indicator gives a bullish signal: it is above the signal line and the gap is widening.
- The Stochastic oscillator is falling but has not reached the oversold zone.
We believe the bullish momentum will continue after the price closes above the upper boundary of Donchian channel at 5530.64. This level can be used as an entry point for placing a pending order to buy. The stop loss can be placed below the last fractal low at 5339.49. After placing the order, the stop loss is to be moved every day to the next fractal low, following Parabolic signals. Thus, we are changing the probable profit/loss ratio to the breakeven point. If the price meets the stop loss level (5339.49) without reaching the order (5530.64), we recommend cancelling the order: the market has undergone internal changes which were not taken into account.
Free Reports:
 Get Our Free Metatrader 4 Indicators - Put Our Free MetaTrader 4 Custom Indicators on your charts when you join our Weekly Newsletter
 Get our Weekly Commitment of Traders Reports - See where the biggest traders (Hedge Funds and Commercial Hedgers) are positioned in the futures markets on a weekly basis.
Technical Analysis Summary
| Position | Buy |
| Buy stop | Above 5530.64 |
| Stop loss | Below 5339.49 |
Market Analysis provided by IFCMarkets