By IFCMarkets
Theresa May decided to lead Brexit negotiations
British Prime Minister Teresa May is going to lead negotiations on the UK’s exit from the EU (Brexit). Will GB100 stock index prices rise?
Earlier, Theresa May dismissed British Foreign Secretary Boris Johnson and Brexit Secretary David Davis. The new Brexit Secretary became Dominic Raab. It is supposed that he will be only the representative of the head of the UK government Theresa May. Market participants do not exclude that the new team will be able to provide more comfortable terms for the Britain’s withdrawal from the EU. Especially considering the visit of US President Donald Trump to the UK and his consultations with Theresa May. Negotiations should be completed in November of the current year, and Brexit itself will be held in March 2019. In recent days, GP100 has grown amid a global increase in banking sector stocks, as well as an increase in mining companies stocks, after a noticeable rise of non-ferrous metals prices. The continuous season of quarterly earnings reports of British companies will affect its dynamics. It can be noted that the FTSE100 is now traded with a P/E ratio of 13 and a dividend yield of 4%. This is slightly better than the indicators of the European stock index STOXX 600 (P / E = 15 and dividend yield 3.4%).
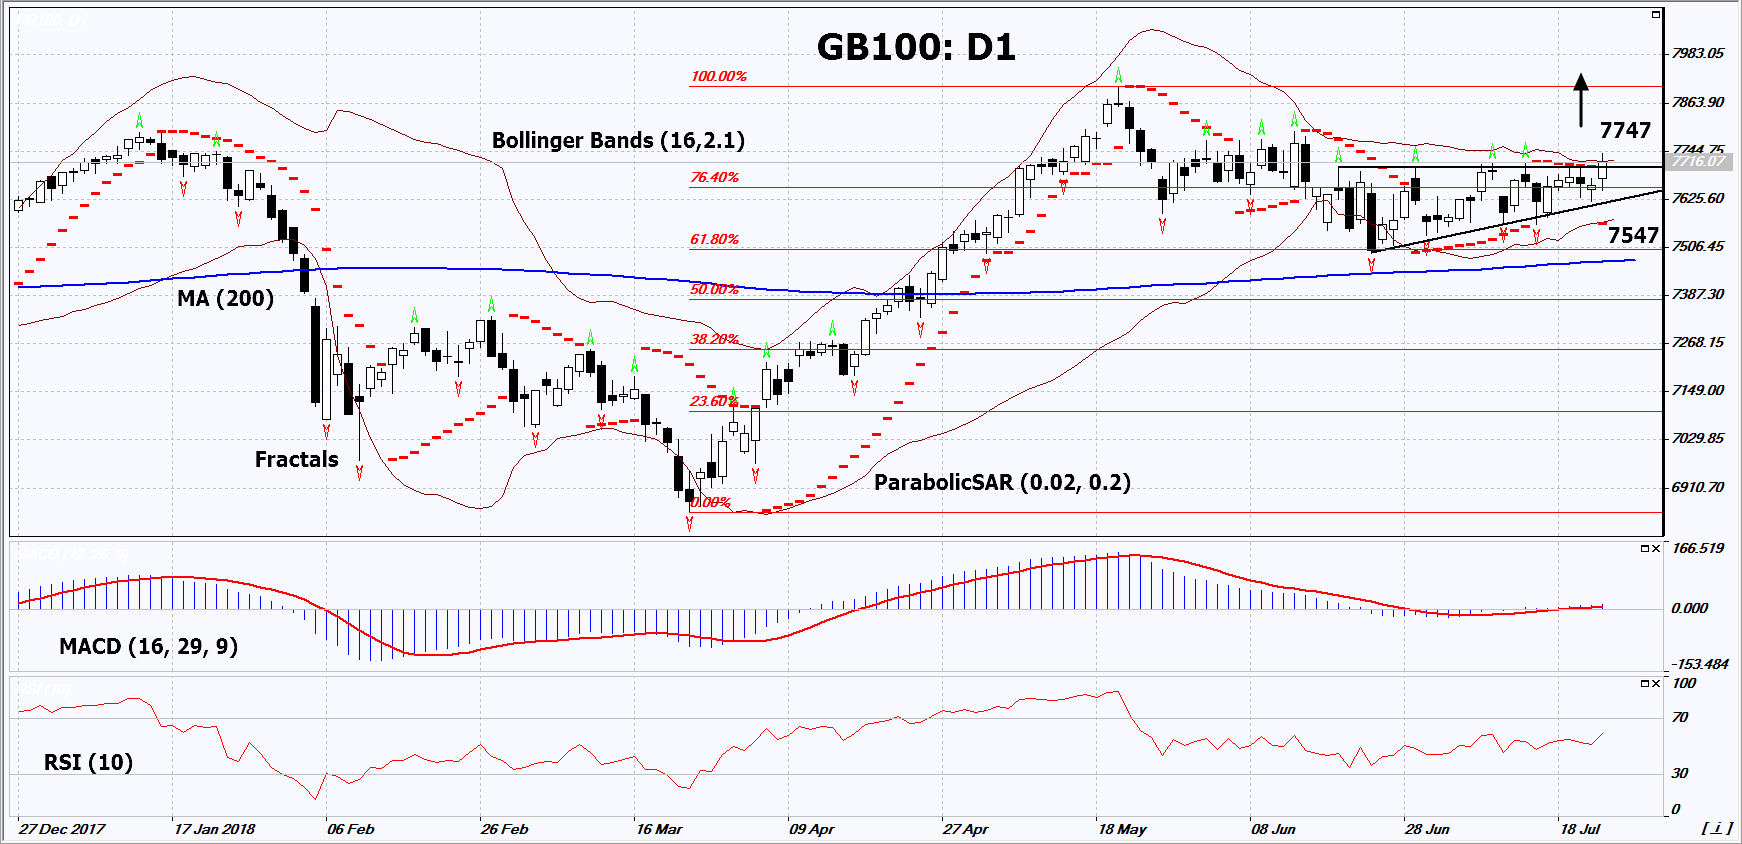
On the daily timeframe, GB100: D1 is trying to move upward from the triangle. A number of technical analysis indicators formed buy signals. The further price increase is possible in case of positive corporate earnings reports and successful Brexit negotiations.
- The Parabolic indicator gives a bullish signal.
- The Bollinger bands have narrowed, which indicates low volatility. They are titled upward.
- The RSI indicator is above 50. No divergence.
- The MACD indicator gives a bullish signal.
The bullish momentum may develop in case GB100 exceeds its 4 last fractal highs and the upper Bollinger band at 7747. This level may serve as an entry point. The initial stop loss may be placed below the two last fractal lows, the Parabolic signal and the lower Bollinger band at 7547. After opening the pending order, we shall move the stop to the next fractal low following the Bollinger and Parabolic signals. Thus, we are changing the potential profit/loss to the breakeven point. More risk-averse traders may switch to the 4-hour chart after the trade and place there a stop loss moving it in the direction of the trade. If the price meets the stop level (7547) without reaching the order (7747), we recommend to close the position: the market sustains internal changes that were not taken into account.
Summary of technical analysis
| Position | Buy |
| Buy stop | Above 7747 |
| Stop loss | Below 7547 |
Market Analysis provided by IFCMarkets
Free Reports:
 Get Our Free Metatrader 4 Indicators - Put Our Free MetaTrader 4 Custom Indicators on your charts when you join our Weekly Newsletter
 Get our Weekly Commitment of Traders Reports - See where the biggest traders (Hedge Funds and Commercial Hedgers) are positioned in the futures markets on a weekly basis.