Article By RoboForex.com
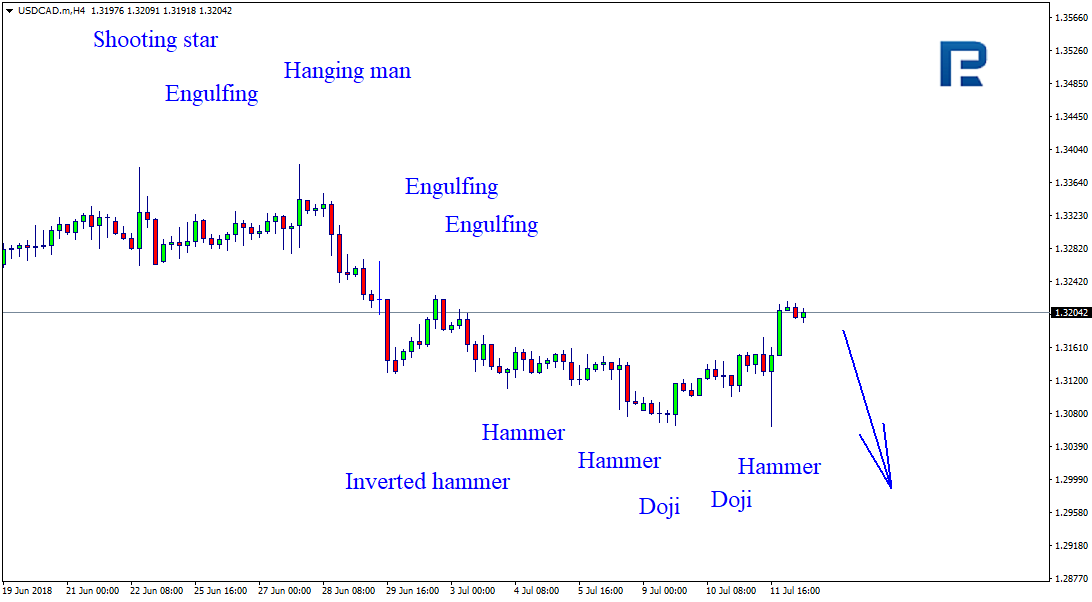
USDCAD, “US Dollar vs Canadian Dollar”
As we can see in the H4 chart, USDCAD continues falling; from time to time, it stops near support levels and forms Hammer, Doji, and Inverted Hammer reversal patterns. At the moment, the price is being corrected once again. Judging by the previous movements, it may be assumed that the instrument may finish the pullback, break the support level, and then continue falling.

AUDUSD, “Australian Dollar vs US Dollar”
As we can see in the H4 chart, AUDUSD keeps growing and forming several Doji, Hammer, and Engulfing reversal patterns during pullbacks. Judging by the previous movements, it may be assumed that the instrument may complete the correction and then continue moving upwards.

Article By RoboForex.com
Free Reports:
 Get Our Free Metatrader 4 Indicators - Put Our Free MetaTrader 4 Custom Indicators on your charts when you join our Weekly Newsletter
 Get our Weekly Commitment of Traders Reports - See where the biggest traders (Hedge Funds and Commercial Hedgers) are positioned in the futures markets on a weekly basis.
Attention!
Forecasts presented in this section only reflect the author’s private opinion and should not be considered as guidance for trading. RoboForex LP bears no responsibility for trading results based on trading recommendations described in these analytical reviews.