By The Gold Report
Source: Clive Maund for Streetwise Reports 06/06/2018
Technical analyst Clive Maund examines recent movements in the gold market.
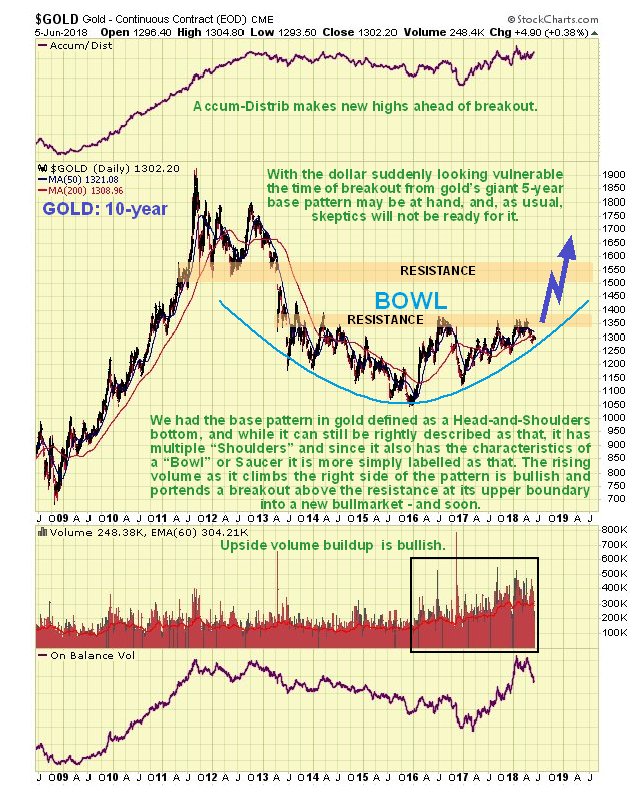
Gold’s breakout from its giant 5-year base pattern has had to wait for the dollar rally to run its course, which it now appears to have done, and this being the case, gold is now free to break out into a major bull market that looks set to dwarf all prior ones. We have in the past described gold’s base pattern from 2013 as a complex (multi-shouldered) Head-and-Shoulders bottom and while this description is still valid, it is perhaps more simply described as a Bowl or Saucer pattern, that is shown on its latest 10-year chart below. For one of these patterns to be valid, volume should build as the price starts to rise out of the Saucer, and as we can see, that is indeed the case, and with the price now being driven by the ascending Saucer boundary towards the resistance that marks its upper boundary, breakout looks imminent. If we stop and think about the growth of debt and money supply while this giant base pattern has been building out, it is clear that gold has a lot of catching up to do.
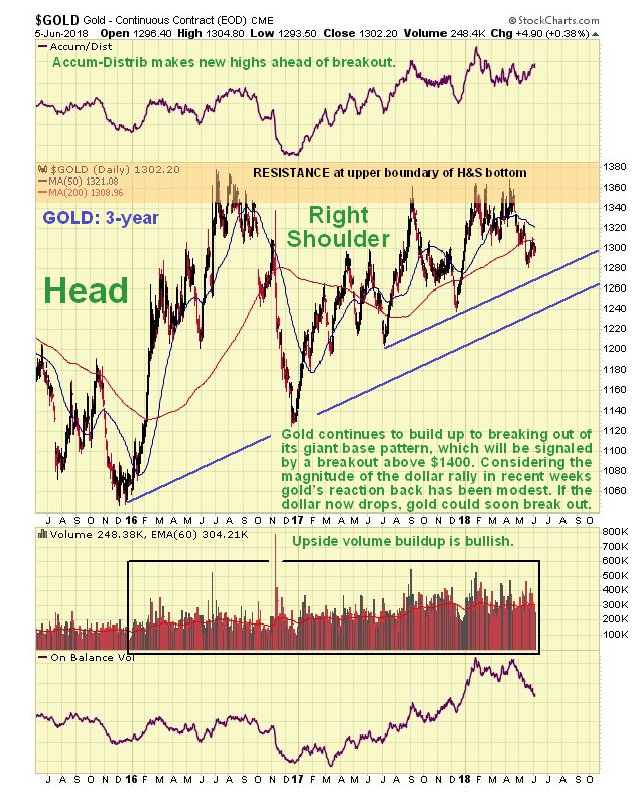
Given that gold’s base pattern can also be described as a complex Head-and-Shoulders bottom as mentioned above, it is easier to look at it in terms of that on a 3-year chart. On this chart we see the Head of the pattern and the messy Right Shoulder and that golds overall trend is now up, with it being driven at the key resistance by the trend lines shown and also by the rising Bowl or Saucer boundary, which it is not practical to show on this chart, but which from glancing at the 10-year chart, we can see is now approximately where the upper trend line is. Breakout must occur within a few months, and while it could happen at any time, the best time for it from a seasonal perspective would be AugustSeptember. While this may seem like a long time to impetuous types, it’s not after a 5-year buildup, and any time remaining to breakout affords us the luxury of being able to buy up the best stocks and adjust portfolios, etc., so that we are able to reap the maximum advantage from the bull market, which will feel even better, because while most precious metal sector investors will be making money, the majority of the population will be getting poorer in a hurry. Before leaving this chart it is worth observing that gold has held up very well in recent weeks, given the magnitude of the dollar rally during this period, which is a positive sign.
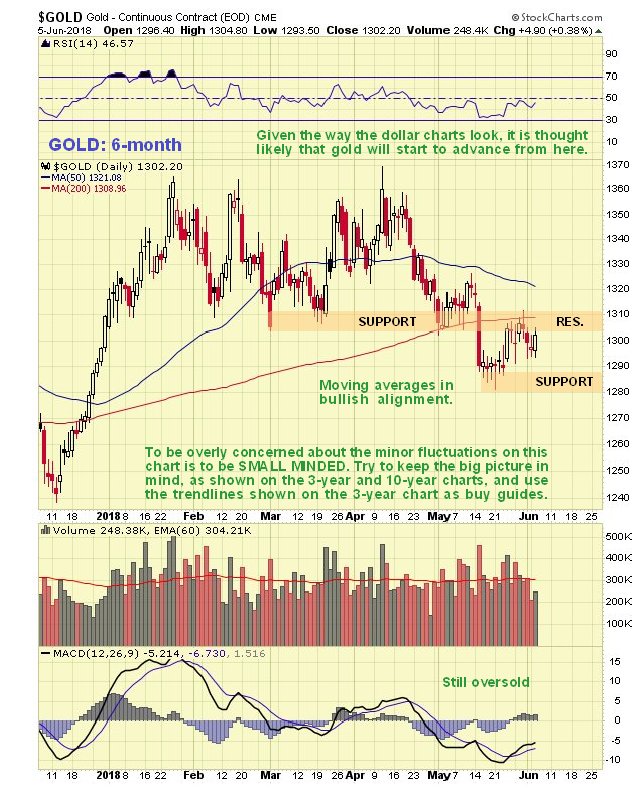
The 6-month chart shows us recent action in more detail, but otherwise it is of little use technically, and is actually deceptive, because it shows gold trending lower, but we know that longer-term charts reveal that the larger trend is up. On this chart we see that moving averages are still in bullish alignment, but there is an impending bearish average cross if the price stays down, so we will want to see it advancing again soon, which is what we are expecting.
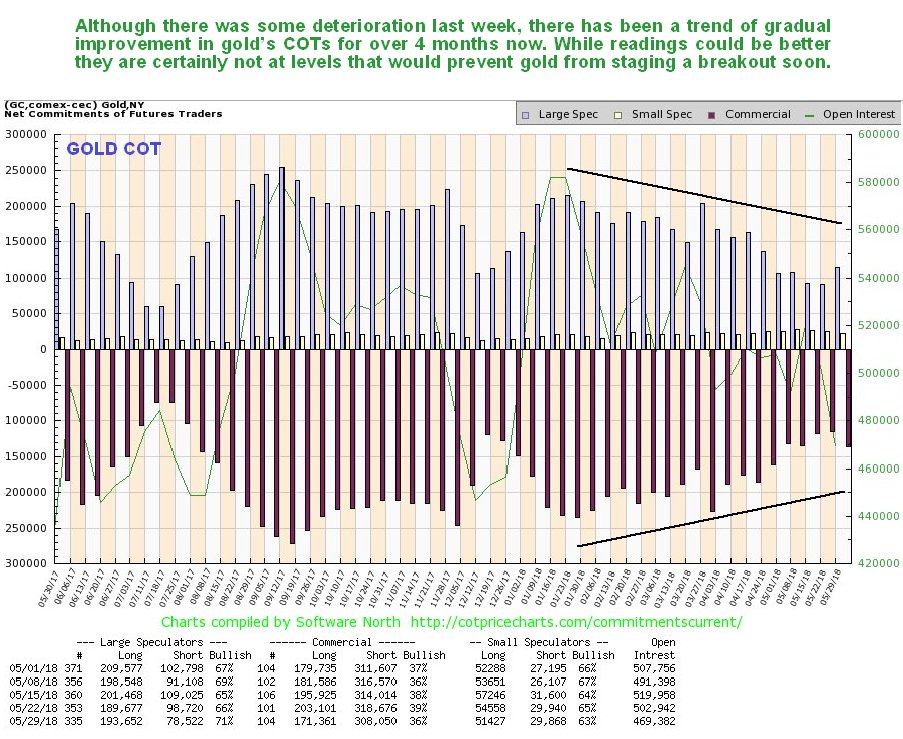
Gold’s latest COT chart showed some deterioration last week, which could lead to a minor dip, but overall we have seen an improving trend in readings since late January, with Commercial short and Large Spec long positions moderating from fairly high levels. While readings could be better, they are not at levels that would prevent a breakout by gold from its giant base pattern, and there is scope for improvement in coming weeks ahead of the breakout, if it doesn’t happen immediately.
Free Reports:
 Get Our Free Metatrader 4 Indicators - Put Our Free MetaTrader 4 Custom Indicators on your charts when you join our Weekly Newsletter
 Get our Weekly Commitment of Traders Reports - See where the biggest traders (Hedge Funds and Commercial Hedgers) are positioned in the futures markets on a weekly basis.
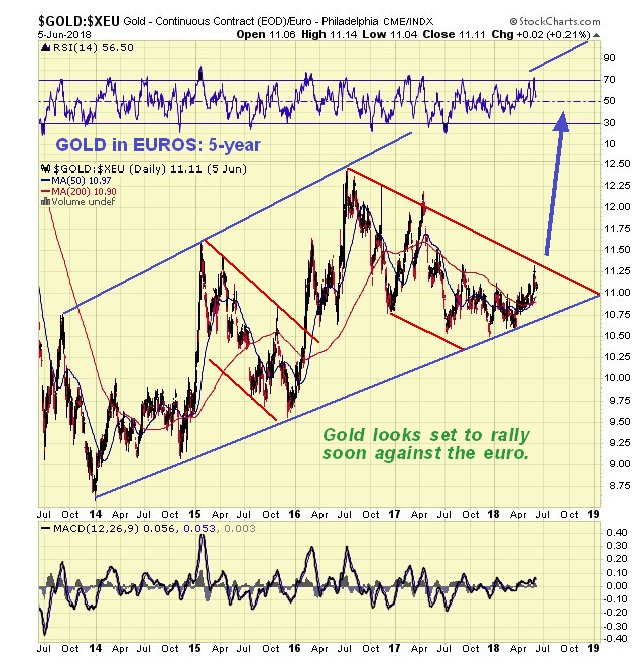
It’s always interesting to look at gold in other currencies. On our 5-year chart for the gold in euros, we see that it near to the bottom of a large uptrend channel and looks set to rally back towards the upper boundary again. Given that the dollar looks set to drop back, which implies a recovery rally in the battered euro, this further means that gold should rally even more against the dollar.
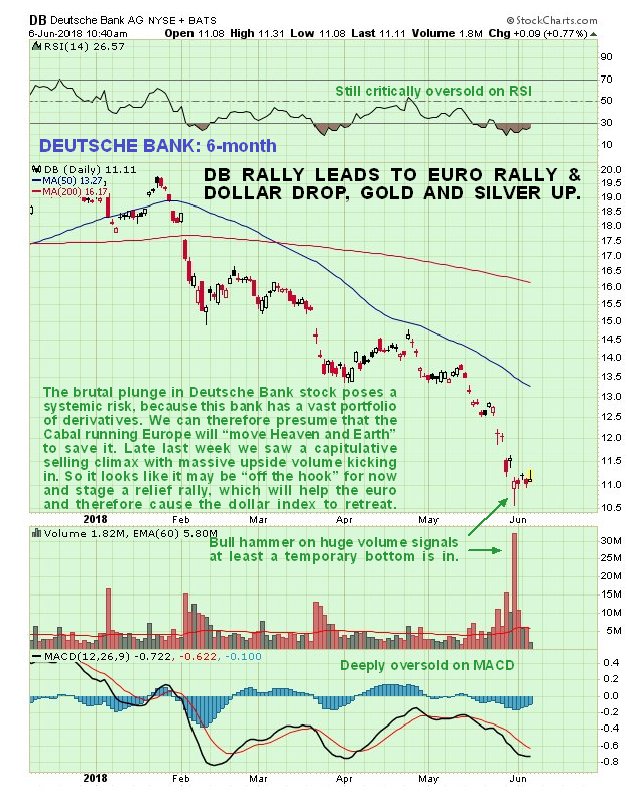
For the euro to recover, we need to see an easing of the acute crisis centering on beleaguered Deutsche Bank, especially as this bank holds vast quantities of derivatives and thus constitutes a major systemic risk. So it relevant here to see what the charts are saying about Deutsche Bank stock. The latest 6-month chart for Deutsche Bank is actually encouraging and implies an easing of the banking crisis in Europe, at least for a while, for as can see the stock plunged into a high volume capitulative selling climax late last week, that left behind a bull hammer on the chart, and although the price range of the hammer was not impressive, volume was and suggests that it is done falling for now and could soon rally, which would probably lead to a rally in the euro too. We can presume that the Cabal running Europe will “move heaven and Earth” to stop it crumbling further.
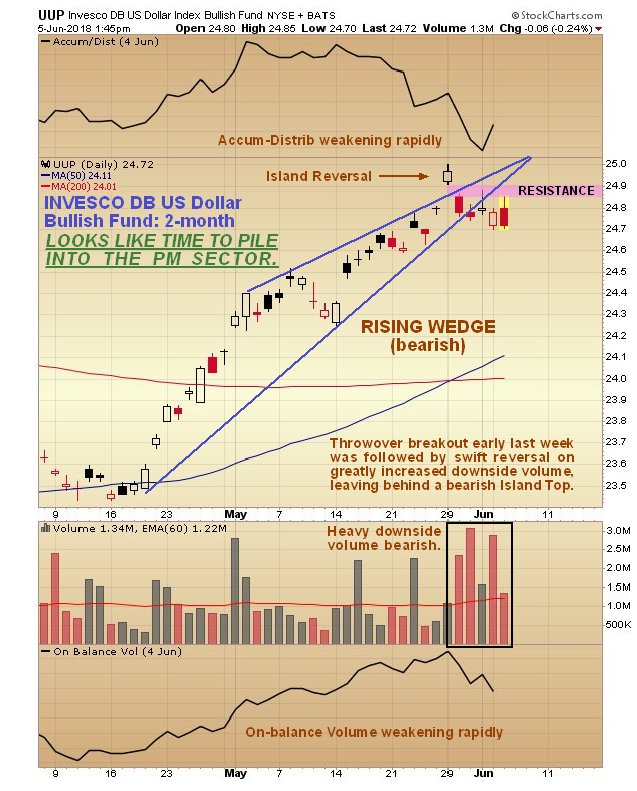
Turning now to the dollar we know that it has had a strong rally since the middle of April, which we will examine not on the chart for the dollar index itself, but on a 2-month chart for the reliable dollar proxy, the Invesco US Dollar Index Bullish Fund, code UUP, the reason being that we can observe its volume pattern and volume indicators. The rally in UUP (and thus the dollar) from the middle of April has taken the form of bearish Rising Wedge, which shows an advance that is losing impetus, and thus at growing risk of reversing. Early last week there was an interesting and bearish development when UUP gapped out of the top of this converging channel, only to gap back into it the next day on much heavier volume, action which left behind a bearish “Island Reversal” on the chart, while the dollar index itself put in a “Bearish Engulfing Pattern” on its chart. Since then it has broken down from the uptrend by virtue of moving sideways with very heavy downside volume developing that has caused volume indicators to weaken rapidly. This is viewed as very bearish and suggests that the dollar has peaked, which if true, is clearly good news for gold and silver.
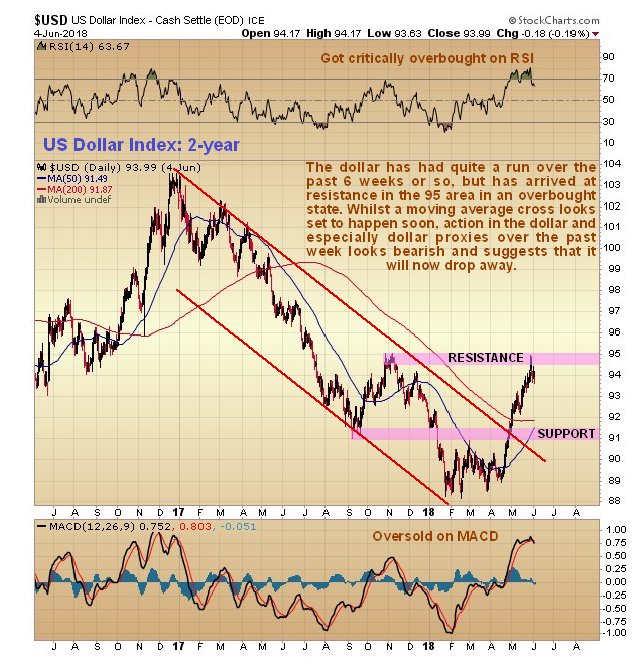
So how does the dollar look on longer-term charts? Is there anything to indicate why it should top out here? There is: on the 2-year chart for the dollar index we can see that it has arrived at a resistance level at its highs of last OctoberNovember in a very overbought state, and is looking toppy here. Very heavy lopsided short positions have built up before this rally started and so it could largely have been driven by self-feeding short covering, and if that is the case it is headed south again. Big reasons for the rally fundamentally were the banking crisis in Europe coming to the fore again and the Fed having set up an interest rate differential between the U.S. and the rest of the world, but if the crisis in Europe should ease, at least for now, as suggested by the high volume selling climax in Deutsche Bank stock a few days back, and the market comes round to thinking that the Fed will abandon at least some of its planned rate rises, then there is plenty of scope for the dollar to drop back again, especially given the accelerating abuse it is being subjected to via the exponential ramping up of debt.
The 5-year chart for the dollar index shows that a giant Broadening Formation has been building since early 2015, which is bearish, but before breaking down it often leads to a period of wild and erratic trading.

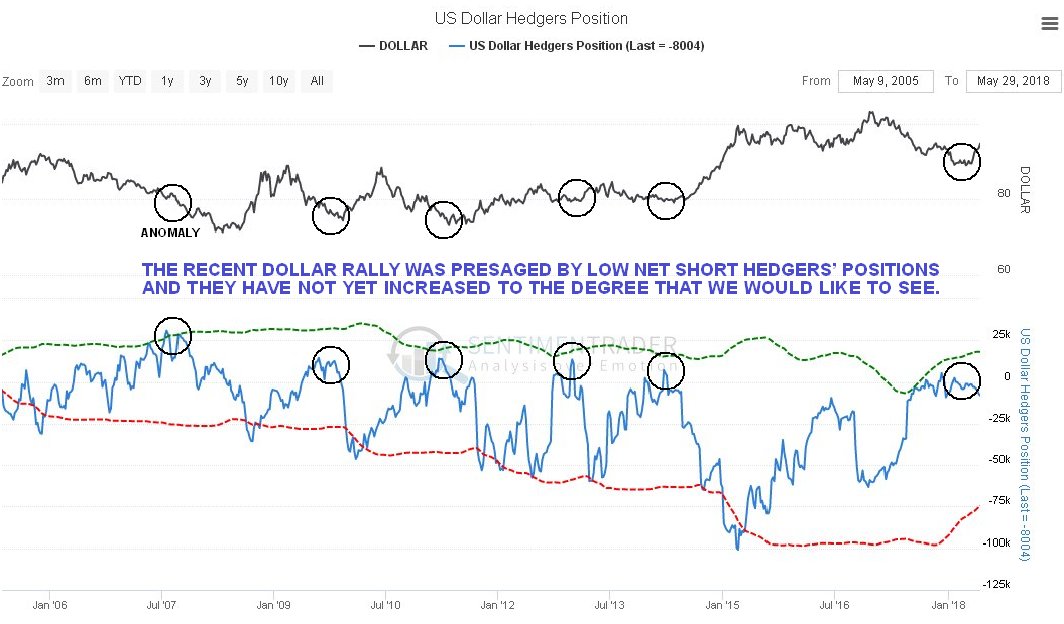
Complicating matters is the latest dollar Hedgers chart. This presaged the rally of recent weeks, but as we can see, readings have not eased very much despite the significant rally. In itself, this suggests either that the dollar rally has further to go, which contradicts the strong evidence that we have seen on the 2-month UUP chart calling for a drop, or that the dollar will react back to support in the 91 area before advancing again.
Chart courtesy of sentimentrader.com
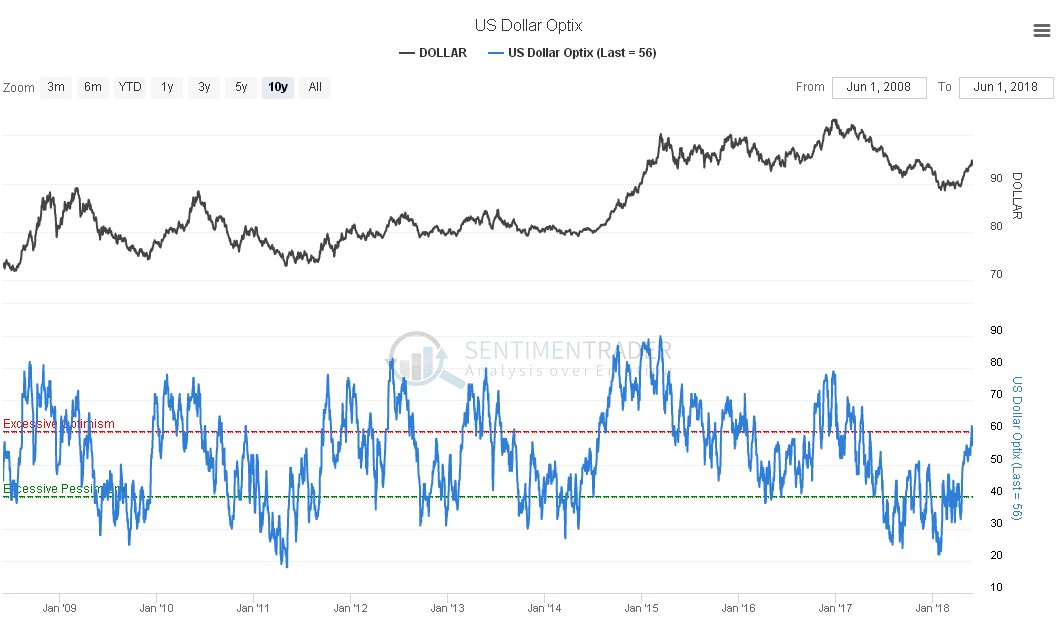
The dollar optix chart on the other hand has risen to levels that could trigger a dollar reversal and drop.
Chart courtesy of sentimentrader.com
Finally, we should remind ourselves of the underlying reasons for the massive and unprecedented incubating bull market in gold and silver, which is that the debt and derivatives mess is now totally out of control, and unlike back in 2008 there is nothing to fall back on to avert the impending major crisis. There is very limited scope to drop interest rates and the money supply has already been vastly inflated by QE. Basically, they have two choices: to try to bring things back under control by hiking rates further and QT (Quantitative Tightening), which given the mammoth debt structure will lead to a devastating economic implosion and widespread social unrest; or to engage in further can kicking by reverting back to QE so that debt expands exponentially, and given the nature of politicians we know which route they are likely to take. At this latest stage of the fiat cycle this will eventually take us over the cliff into hyperinflation, which is a very effective way of eliminating debt, because it makes it worthless. Needless to say, when paper money no longer has any value, gold and silver will then take center stage.
Clive Maund has been president of www.clivemaund.com, a successful resource sector website, since its inception in 2003. He has 30 years’ experience in technical analysis and has worked for banks, commodity brokers and stockbrokers in the City of London. He holds a Diploma in Technical Analysis from the UK Society of Technical Analysts.
Want to read more Gold Report articles like this? Sign up for our free e-newsletter, and you’ll learn when new articles have been published. To see a list of recent articles and interviews with industry analysts and commentators, visit our Streetwise Interviews page.
Disclosure:
1) Clive Maund: I, or members of my immediate household or family, own shares of the following companies mentioned in this article: None. I personally am, or members of my immediate household or family are, paid by the following companies mentioned in this article: None. My company has a financial relationship with the following companies mentioned in this article: None. CliveMaund.com disclosures below. I determined which companies would be included in this article based on my research and understanding of the sector.
2) The following companies mentioned in this article are billboard sponsors of Streetwise Reports: None. Click here for important disclosures about sponsor fees.
3) Statements and opinions expressed are the opinions of the author and not of Streetwise Reports or its officers. The author is wholly responsible for the validity of the statements. The author was not paid by Streetwise Reports for this article. Streetwise Reports was not paid by the author to publish or syndicate this article. The information provided above is for informational purposes only and is not a recommendation to buy or sell any security. Streetwise Reports requires contributing authors to disclose any shareholdings in, or economic relationships with, companies that they write about. Streetwise Reports relies upon the authors to accurately provide this information and Streetwise Reports has no means of verifying its accuracy.
4) This article does not constitute investment advice. Each reader is encouraged to consult with his or her individual financial professional and any action a reader takes as a result of information presented here is his or her own responsibility. By opening this page, each reader accepts and agrees to Streetwise Reports’ terms of use and full legal disclaimer. This article is not a solicitation for investment. Streetwise Reports does not render general or specific investment advice and the information on Streetwise Reports should not be considered a recommendation to buy or sell any security. Streetwise Reports does not endorse or recommend the business, products, services or securities of any company mentioned on Streetwise Reports.
5) From time to time, Streetwise Reports LLC and its directors, officers, employees or members of their families, as well as persons interviewed for articles and interviews on the site, may have a long or short position in securities mentioned. Directors, officers, employees or members of their immediate families are prohibited from making purchases and/or sales of those securities in the open market or otherwise from the time of the interview or the decision to write an article, until one week after the publication of the interview or article.
Charts provided by the author.
CliveMaund.com Disclosure:
The above represents the opinion and analysis of Mr Maund, based on data available to him, at the time of writing. Mr. Maund’s opinions are his own, and are not a recommendation or an offer to buy or sell securities. Mr. Maund is an independent analyst who receives no compensation of any kind from any groups, individuals or corporations mentioned in his reports. As trading and investing in any financial markets may involve serious risk of loss, Mr. Maund recommends that you consult with a qualified investment advisor, one licensed by appropriate regulatory agencies in your legal jurisdiction and do your own due diligence and research when making any kind of a transaction with financial ramifications. Although a qualified and experienced stock market analyst, Clive Maund is not a Registered Securities Advisor. Therefore Mr. Maund’s opinions on the market and stocks can only be construed as a solicitation to buy and sell securities when they are subject to the prior approval and endorsement of a Registered Securities Advisor operating in accordance with the appropriate regulations in your area of jurisdiction.
