By IFCMarkets
Trade wars increase market risks
China sells corn from its state reserves. Will Corn prices continue to fall?
According to the Chinese National Grain Trade Center, 1.33 million tonnes of corn from state reserves were sold at the auction on Friday at the price of 1422 yuan ($ 221.7) per ton. This is about a third of the proposed volume. Last week, corn fell by 2.5%, which was the largest weekly price decrease over the past 10 months. An important reason was the risk of the resumption of global trade wars. The US is going to raise duties on imports of steel and aluminum from Mexico, the European Union and Canada. Meanwhile, Mexico is the main buyer of US corn and may, in response, increase duties on its imports from the US. This increases the risk of demand reduction.
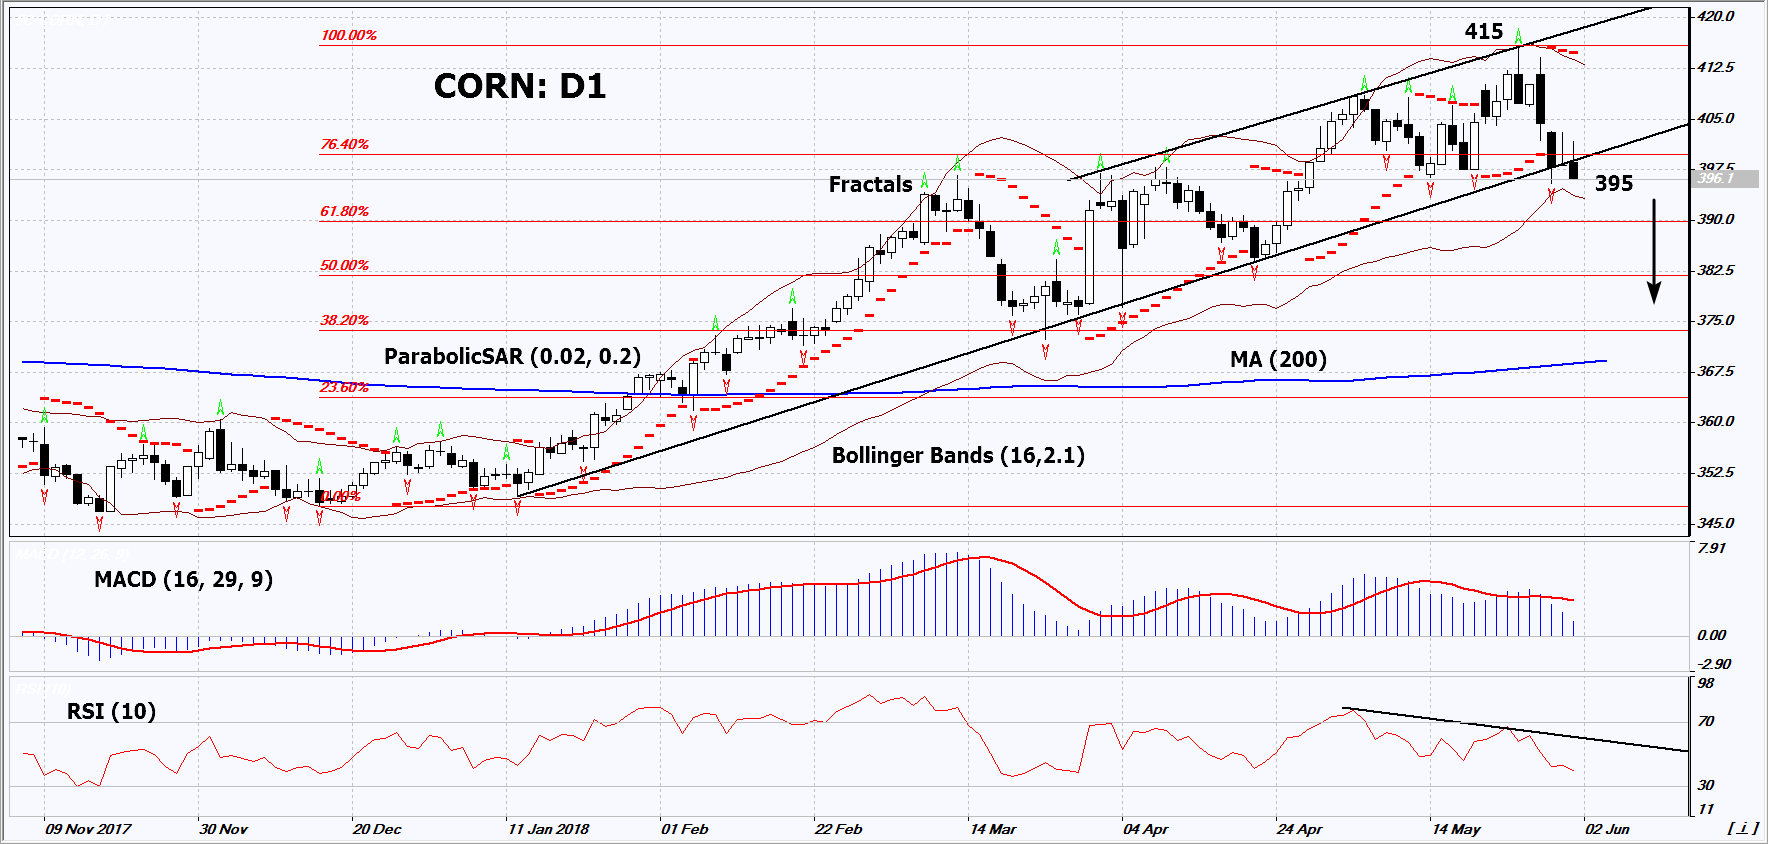
On the daily timeframe, Corn: D1 breached down the support line of the uptrend. The further price decrease is possible in case of a reduction in purchases of US corn by Mexico and in case of the further sales of Chinese state reserves.
- The Parabolic indicator gives a bearish signal.
- The Bollinger bands have narrowed, which indicates low volatility. They are titled downward.
- The RSI indicator is below 50. It has formed a negative divergence.
- The MACD indicator gives a bearish signal.
The bearish momentum may develop in case Corn falls below its last fractal low at 395. This level may serve as an entry point. The initial stop loss may be placed above the last fractal high, the 2-year high, the upper Bollinger band and the Parabolic signal at 415. After opening the pending order, we shall move the stop to the next fractal high following the Bollinger and Parabolic signals. Thus, we are changing the potential profit/loss to the breakeven point. More risk-averse traders may switch to the 4-hour chart after the trade and place there a stop loss moving it in the direction of the trade. If the price meets the stop level at 415 without reaching the order at 395, we recommend to close the position: the market sustains internal changes that were not taken into account.
Summary of technical analysis
| Position | Sell |
| Sell stop | Below 395 |
| Stop loss | Above 415 |
Market Analysis provided by IFCMarkets
Free Reports:
 Get Our Free Metatrader 4 Indicators - Put Our Free MetaTrader 4 Custom Indicators on your charts when you join our Weekly Newsletter
 Get our Weekly Commitment of Traders Reports - See where the biggest traders (Hedge Funds and Commercial Hedgers) are positioned in the futures markets on a weekly basis.