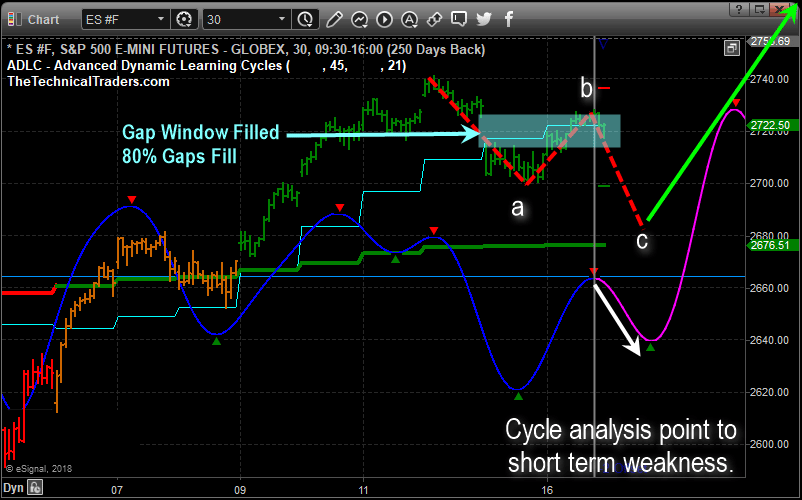
The 30-minute chart price pattern with a large gap down in price on Tuesday morning created what we call a “Gap Window”. Almost all gaps in the SP500 get filled eventually, and both the top and bottom areas of a gap window become short-term resistance or support.
A three-wave a-b-c correction is generally what causes stop orders to be run, panic selling, and creates a pivot low. This is displayed with a red line on the chart.
If this very short-term pattern unfolds it would create fantastic entry point because several different types of analysis come into play at the same time and price. The green 20-day simple moving average and our short-term cycle projection would act as support and a cycle low.
Our articles, Technical Trading Mastery book, and 3 Hour Trading Video Course are designed for both traders and investors to explore the tools and techniques that discretionary and algorithmic traders need to profit in today’s competitive markets. Created with the serious trader and investor in mind – whether beginner or professional – our approach will put you on the path to win. Understanding market structure, trend identification, cycle analysis, volatility, volume, when and when to trade, position management, and how to put it all together so that you have a winning edge.
Free Reports:
 Get Our Free Metatrader 4 Indicators - Put Our Free MetaTrader 4 Custom Indicators on your charts when you join our Weekly Newsletter
 Get our Weekly Commitment of Traders Reports - See where the biggest traders (Hedge Funds and Commercial Hedgers) are positioned in the futures markets on a weekly basis.