Article By RoboForex.com
XAUUSD, “Gold vs US Dollar”
As we can see in the H4 chart, after reaching the support level, XAUUSD has formed several Hammer and Doji reversal patterns. These patterns indicate that the instrument may have completed the correction and may soon resume moving to the upside.
 Risk Warning: the results of previous trading operations do not guarantee the same results in the future.
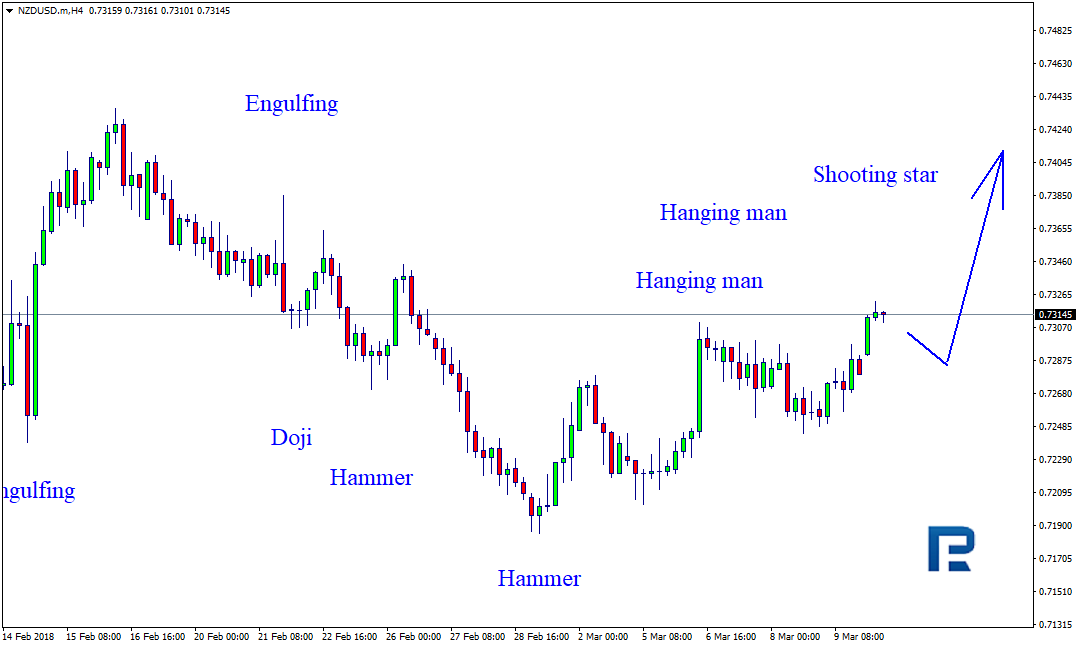
NZDUSD, “New Zealand vs. US Dollar”
As we can see in the H4 chart, after reaching another resistance level, NZDUSD has formed several Shooting Start and Hanging Man reversal patterns there. At the moment, it may be assumed that these candlesticks indicate that the instrument may be corrected for a while before starting a new ascending movement.
Free Reports:
 Get Our Free Metatrader 4 Indicators - Put Our Free MetaTrader 4 Custom Indicators on your charts when you join our Weekly Newsletter
 Get our Weekly Commitment of Traders Reports - See where the biggest traders (Hedge Funds and Commercial Hedgers) are positioned in the futures markets on a weekly basis.
 Risk Warning: the results of previous trading operations do not guarantee the same results in the future.
RoboForex Analytical Department
Article By RoboForex.com
Attention!
Forecasts presented in this section only reflect the author’s private opinion and should not be considered as guidance for trading. RoboForex LP bears no responsibility for trading results based on trading recommendations described in these analytical reviews.