By IFCMarkets
The Bank of Japan may increase the economic stimulus
On Friday, March 9, 2018, the Bank of Japan meeting took place. Its Governor Haruhiko Kuroda announced his readiness to increase monetary stimulus in case of a slowdown in economic growth. Will the weakening of the yen continue?
On the USDJPY chart, it looks like an increase in quotes. The Bank of Japan economic stimulus implies a further maintenance of the current rate at minus 0.1%, as well as the yen emission for the buying-back of the obligations in the amount of 80 trln yen per year. The aim of the Bank of Japan is to increase inflation to 2% per year by March 2020, while its current level is 1.4%. Soft monetary policy contributes to the weakening of the yen. The next Bank of Japan meeting will be held on April 27, 2018. Another negative factor for the Japanese currency may be the US plans to further tighten the foreign trade. The US president Donald Trump is going to reduce the US foreign trade deficit and has recently imposed prohibitive duties on the imports of steel and aluminum. The Japanese economy may suffer because of a reduction in the trade surplus with the US. The reaction of the foreign exchange market participants to Donald Trump’s plans to negotiate with the North Korean leader turned out to be negative for the yen, as it may significantly reduce political risks in the region. Accordingly, the yen may lose the “safe haven” status for investors. Last week USDJPY showed the maximum growth in 5 weeks. Since the beginning of the year, it has already increased by 7%.

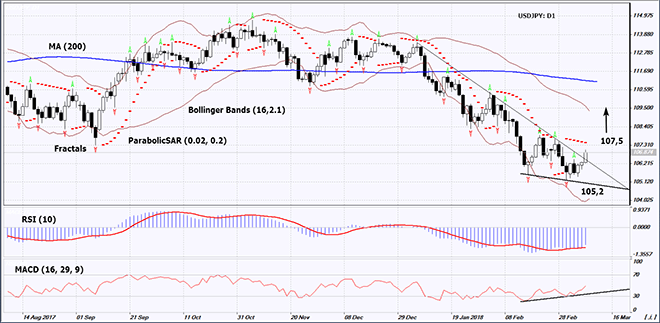
On the daily timeframe, USDJPY: D1 moved upwards from the falling range. The further price increase is possible in case of the publication of positive economic data in the US and negative ones in Japan.
- The Parabolic indicator gives a bearish signal. It may be use as an additional resistance level which needs to be overcome to open a Buy position.
- The Bollinger bands have widened, which means higher volatility. The lower band is tilted upwards.
- The RSI indicator is above 50. It has formed a positive divergence.
- The MACD indicator gives a bullish signal.
The bullish momentum may develop in case USDJPY exceeds the Parabolic signal at 107.5. This level may serve as an entry point. The initial stop loss may be placed below the last fractal low and the 15-month high at 105.2. After opening the pending order, we shall move the stop to the next fractal low following the Bollinger and Parabolic signals. Thus, we are changing the potential profit/loss to the breakeven point. More risk-averse traders may switch to the 4-hour chart after the trade and place there a stop loss moving it in the direction of the trade. If the price meets the stop level at 105.2 without reaching the order at 107.5, we recommend cancelling the position: the market sustains internal changes that were not taken into account.
Summary of technical analysis
| Position | Buy |
| Buy stop | above 107,5 |
| Stop loss | below 105,2 |
Market Analysis provided by IFCMarkets
Free Reports:
 Get Our Free Metatrader 4 Indicators - Put Our Free MetaTrader 4 Custom Indicators on your charts when you join our Weekly Newsletter
 Get our Weekly Commitment of Traders Reports - See where the biggest traders (Hedge Funds and Commercial Hedgers) are positioned in the futures markets on a weekly basis.