By IFCMarkets
Rising yields bearish for SP500
Strong economic data make further tightening by the Federal Reserve more likely. Will SP500 decline further?
US equities slumped Monday as the better than expected January jobs report spurred concerns the Federal Reserve may tighten monetary policy faster than previously believed on recent strong economic data. Earlier the Atlanta Fed increased its GDP growth forecast last week to 5.4% annually from current 2.5% rate. Last Monday the Bureau of Economic Analysis report indicated US inflation is rising faster than expected: the core personal consumption expenditure index rose 0.2% on month in December from 0.1% the previous month. The nonfarm payrolls report, indicating rising wages and lower than expected unemployment, increased the likelihood the Federal Reserve may accelerate the pace of interest rate hikes. This will drag economic growth as higher borrowing costs slow down business investment. Comments of two Fed officials Wednesday were hawkish in light of recent developments. New York Fed President William Dudley said the recent drop in the stock market wasn’t big enough to alter the economic outlook. And Chicago Fed President Charles Evans, a leading dove among his colleagues, said that if officials get “more confidence that inflation is moving up sustainably, then further rate increases would be warranted.” High interest rates are bearish for stocks as they limit access to cheap financing for US companies.
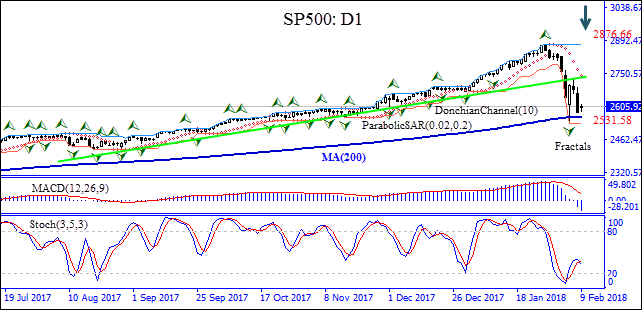
On the daily chart the SP500: D1 has edged higher after Monday correction. It breached below 200-day moving average MA(200) Tuesday but closed above it and has fallen below the support line.
- The Donchian channel indicates no trend yet: it is flat.
- The Parabolic indicator has formed a sell signal.
- The MACD indicator is below the signal line and the gap is widening, which is a bearish signal.
- The stochastic oscillator is falling but has not reached the oversold zone yet.
We believe the bearish momentum will continue after the price closes below the lower Donchain boundary at 2531.58, which is confirmed also by fractal low. It can be used as an entry point for a pending order to sell. The stop loss can be placed above the last fractal high at 2876.66. After placing the pending order the stop loss is to be moved every day to the next fractal low, following Parabolic signals. Thus, we are changing the probable profit/loss ratio to the breakeven point. More conservative traders can switch to the 4-hour chart and move the stop-loss in the direction of the trade. If the price meets the stop loss level (2876.66) without reaching the order (2531.58), we recommend cancelling the order: the market sustains internal changes which were not considered.
Technical Analysis Summary
| Position | Sell |
| Sell stop | Below 2531.58 |
| Stop loss | Above 2876.66 |
Market Analysis provided by IFCMarkets
Free Reports:
 Get Our Free Metatrader 4 Indicators - Put Our Free MetaTrader 4 Custom Indicators on your charts when you join our Weekly Newsletter
 Get our Weekly Commitment of Traders Reports - See where the biggest traders (Hedge Funds and Commercial Hedgers) are positioned in the futures markets on a weekly basis.