By Admiral Markets

Dear traders,
I’m sure that many of you have seen price charts of financial instruments at one moment or another. Typically, the chart will show multiple tools and indicators, including but not limited to trend lines, oscillators, Fibonacci tools, moving averages, and much more.
This article reviews whether applying technical analysis provides any benefit to analysts, especially to those traders who are just starting.
Does Technical Analysis Help?
…depending on who you ask. Some people believe that looking at historical price data will not provide any value for current decisions. They believe that the random walk theory (or efficient-market hypothesis) is true, which states that financial market prices move and behave according to a random walk (price changes are random) and thus cannot be predicted.
Many investors, however, heavily dispute this theory, including a famous investor
Warren Buffet, who commented that he is “convinced that there is much inefficiency in the market”. Inefficiencies, in turn, create potential opportunities for traders to capitalise on price movements. They believe that analysing price action, in fact, allows traders to make better trading decisions.
Free Reports:
 Get Our Free Metatrader 4 Indicators - Put Our Free MetaTrader 4 Custom Indicators on your charts when you join our Weekly Newsletter
 Get our Weekly Commitment of Traders Reports - See where the biggest traders (Hedge Funds and Commercial Hedgers) are positioned in the futures markets on a weekly basis.
Which one is true? Well nobody can know for sure, but I can share my view: technical analysis does help. In the remainder of the article, I will explain why and how technical and chart analysis helps my analysis and trading.
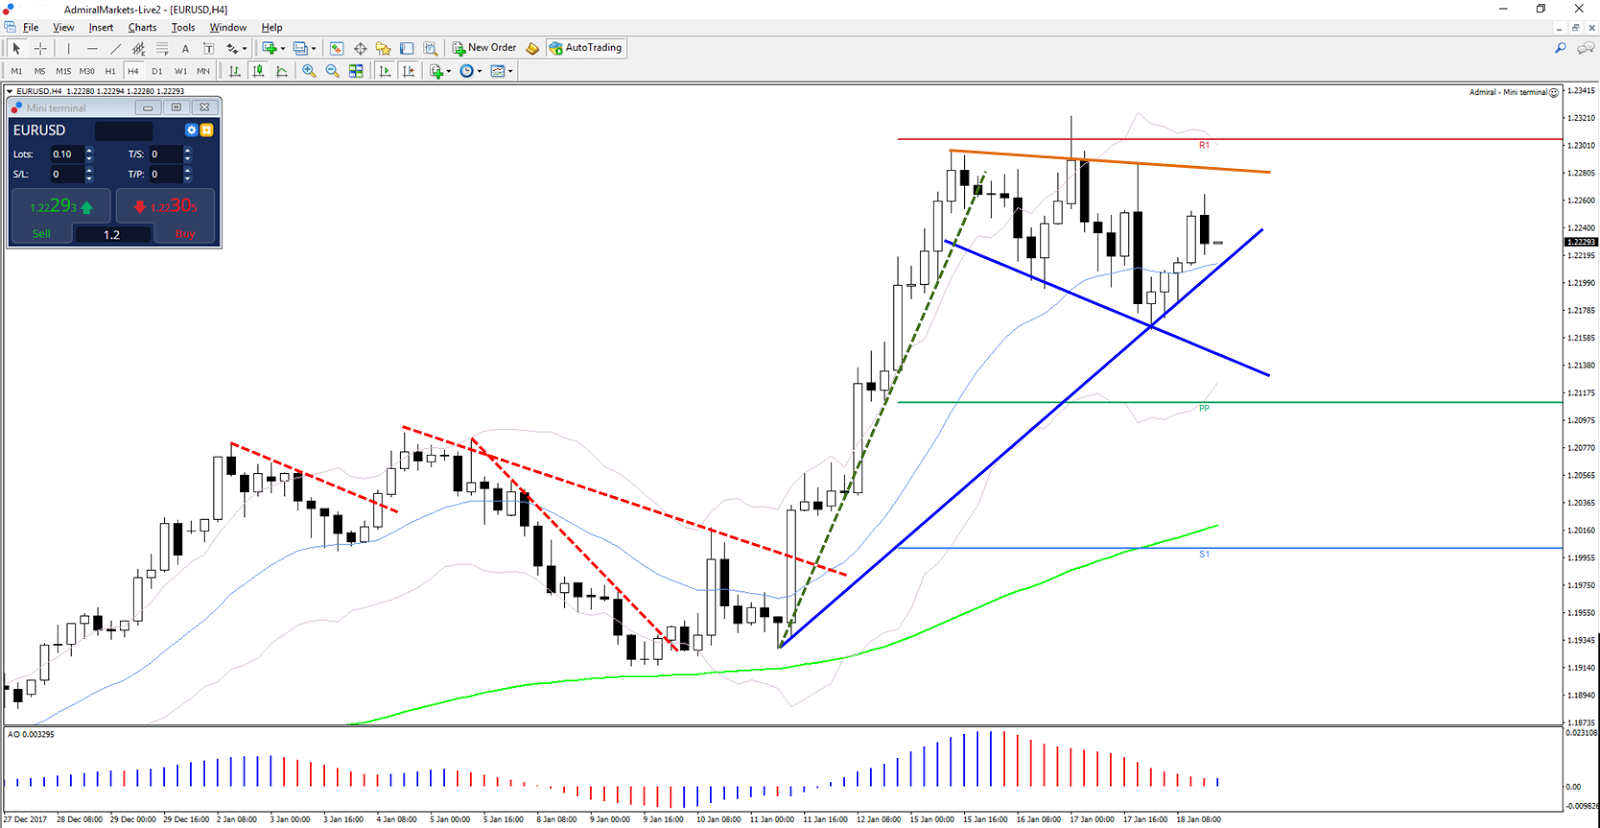
Source: EUR/USD 4-hour chart from 27 December 2017 to 18 January 2018 showing trend lines, 1 moving average (green), Admiral Keltner channel (light purple), Admiral Pivot Points (S1, PP, R1), and AO
How and Why Does Technical Analysis Help?
The financial markets are not simple concepts. They are impacted and influenced by a wide range of factors including for instance, monetary policies by central banks, fiscal policies by governments, and many internal economic factors that are determined by companies and consumers.
Studying all those factors, realising how they impact all of the assets and markets, and knowing which factors have the most impact is an incredibly difficult task. In my view, it would take an enormous amount of energy and attention to draw reliable conclusions from the reviewing so many angles.
Equally important, when analysing these factors, it is easy to see that traders can make errors in cause and effect. This is particularly true for individual traders who have limited time and focus.
However, the good news is that there is a reliable short-cut in my eyes where analysts can focus a lot of their attention on just one piece of data – price movement. What is this shortcut?
Technical analysis! Technical analysis (TA) is also known as chart analysis. TA allows traders to analyse historical price movement. This analysis can then offer traders:
- A way how to judge whether the chart is interesting to trade or not.
- How traders can look for potential trade setups.
- Where traders can find potential trade setups.
- How to manage those potential trade setups.
How Can Traders Use Technical Analysis?
Although analysing price action is the study of the price and the price only, logically, it does require some training, practice, and experience before traders can fluently use the information to their advantage.
Luckily, Admiral Markets offers a wide range of tools that help traders with understanding technical analysis in more depth such as:
- Live trading webinars;
- Live educational webinars;
- Live technical analysis;
- Live wave analysis;
- Forex 101 beginner’s trading course;
- Zero to Hero trading course;
- Master trading webinars;
- Library of tutorials and articles;
- Our trader’s blog;
- SE plug-in, and much more
All these tools help show traders how they can improve their technical analysis skills and implement a better and more solid trading plan from A to Z.
The process, however, is well worth it because analysing the charts is luckily a fun and challenging activity.
For my own personal trading, I fully focus on analysing:
- Support & Resistance;
- Trend and momentum;
- Price patterns, such as, among others, wave patterns, candlestick patterns, chart patterns, divergence patterns, and time patterns.

Source: USD/JPY 4-hour chart from 27 December 2017 to 18 January 2018 showing trend lines, 1 moving average (green-orange), Admiral Keltner channel (light purple), Admiral Pivot Points (S1, PP, R1), AO, and Fibonacci levels
To understand these 3 factors in greater depth, I use tools and indicators to analyse them in a deeper way. My favourite tools are:
- Moving averages;
- Admiral Pivot Points (PP);
- MACD / Awesome Oscillator;
- Admiral Keltner channel;
- Fibonacci;
- Trend lines and channels;
- Fractals
To get more free information about the Admiral PP and Channel, feel free to watch the video above or download the
Supreme Edition plug-in to test it yourself.
Wishing you a happy week of trading,
Chris Svorcik
Follow
@ChrisSvorcik on Twitter for the latest market updates!
Connect with
Chris Svorcik on Facebook for more Forex and CFD analysis!

Forex and CFD trading carries a high level where losses can exceed your deposits. This material is does not contain, and should not be construed as containing, investment advice or an investment recommendation or, an offer of or solicitation for any transactions in financial instruments. Please note that the trading analyses which refers to past performance, may change over time. No representation is given as to the accuracy or completeness of the information and any person acting upon it does so entirely at their own risk. Before making any investment decisions, you should seek advice from independent financial advisor to ensure you understand the risks involved.
Article by Admiral Markets
Source: Does Technical Analysis Provide Any Advantages When Trading?

Admiral Markets is a leading online provider, offering trading with Forex and CFDs on stocks, indices, precious metals and energy.