By IFCMarkets
The Food and Agriculture Organization of the United Nations forecasts an increase in the world rice reserves
The rice production is increasing in a number of developing countries. At the same time, a limitation of rice imports to the EU and a growth of the world reserves are expected. Will the rice quotes decrease?
Italy, together with other 6 countries of the EU, advocates limiting the rice imports to the EU through the UK. In addition, the supplies of Indian rice to the EU may be limited in case it contains an increased level of pesticides. Meanwhile, in the Indonesian province of Aceh the rice crop is expected to grow to 2.6 mln tonnes, compared with the earlier forecasted 2.4 mln tonnes. Pakistan increased the rice exports by 17% in July-October of this year compared with the same period of 2016. The African country Mali expects an increase in the rice crop to 2.92 mln tonnes in the 2017/18 agricultural season, which is by 5% more than in the previous season. The Food and Agriculture Organization of the UN forecasts an increase in the world rice reserves in the 2017/18 season.
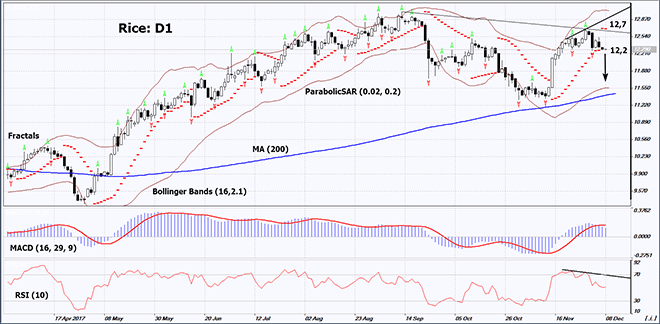
On the daily timeframe, RICE: D1 is in the neutral trend. A downward correction is possible in case of an increase in the world crop.
- The Parabolic indicator gives a bearish signal.
- The Bollinger bands have widened, which means higher volatility. They are tilted downwards.
- The RSI indicator is near 50. It has formed a negative divergence.
- The MACD indicator gives a bearish signal.
The bearish momentum may develop in case RICE drops below the last fractal low at 12.2. This level may serve as an entry point. The initial stop loss may be placed above the last fractal high and the Parabolic signal at 12.7. After opening the pending order, we shall move the stop to the next fractal high following the Bollinger and Parabolic signals. Thus, we are changing the potential profit/loss to the breakeven point. More risk-averse traders may switch to the 4-hour chart after the trade and place there a stop loss moving it in the direction of the trade. If the price meets the stop level at 12.7 without reaching the order at 12.2, we recommend cancelling the position: the market sustains internal changes that were not taken into account.
Free Reports:
 Get Our Free Metatrader 4 Indicators - Put Our Free MetaTrader 4 Custom Indicators on your charts when you join our Weekly Newsletter
 Get our Weekly Commitment of Traders Reports - See where the biggest traders (Hedge Funds and Commercial Hedgers) are positioned in the futures markets on a weekly basis.
Summary of technical analysis
| Position | Sell |
| Sell stop | below 12,20 |
| Stop loss | above 12,7 |
Market Analysis provided by IFCMarkets