By IFCMarkets
Improving economic data bullish for EU50
Improving euro-zone economic performance is bullish for European stocks. Will the EU50 stock index continue the rise?
Recent better than expected data indicate euro-zone economic performance is improving. Eurostat reported on Tuesday euro-zone Q3 GDP grew 2.5% over year instead of expected 2.4% and unemployment fell from 9% to 8.9%, lowest in almost nine years. Improving euro-zone economic performance is bullish for EU50 stock index.
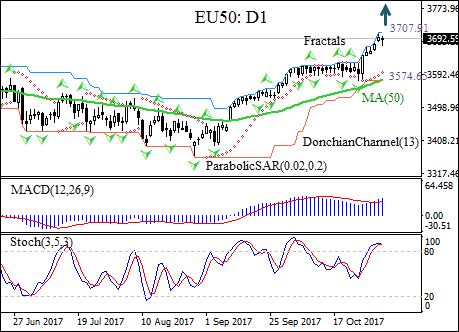
On the daily timeframe EU50: D1 is retracing after it hit 27-month high two sessions ago.
- The Donchian channel indicates no uptrend yet: it is flat.
- The MACD indicator is above the signal line and the gap is widening, which is a bullish signal.
- The Parabolic indicator gives a buy signal.
- The stochastic oscillator has breached into the overbought zone, this is a bearish signal.
We believe the bullish momentum will continue as the price breaches above the upper Donchian boundary at 3707.91. A price point above that level can be used as an entry point for a pending order to buy. The stop loss can be placed below the last fractal low at 3574.65. After placing the pending order the stop loss is to be moved every day to the next fractal low, following Parabolic signals. Thus, we are changing the probable profit/loss ratio to the breakeven point. If the price meets the stop-loss level (3574.65) without reaching the order we recommend cancelling the position: the market sustains internal changes which were not taken into account.
Free Reports:
 Get Our Free Metatrader 4 Indicators - Put Our Free MetaTrader 4 Custom Indicators on your charts when you join our Weekly Newsletter
 Get our Weekly Commitment of Traders Reports - See where the biggest traders (Hedge Funds and Commercial Hedgers) are positioned in the futures markets on a weekly basis.
Technical Analysis Summary
| Position | Buy |
| Buy stop | Above 3707.91 |
| Stop loss | Below 3574.65 |
Market Analysis provided by IFCMarkets