By Admiral Markets

Dear traders,
Many of you feel unsure when trying to apply and “count” wave patterns on the chart. Analysing wave patterns does take some time and experience, but the learning curve is not as steep as it may seem.
This article explains how I approach
Elliott Wave patterns with confidence. It also reveals the concepts and tools best used for setting up wave analysis.
I will help you better understand when to apply wave analysis, how to use confirmation and invalidation levels, and how to actually trade wave patterns.

First Steps With Wave Analysis
The charts of financial markets continuously build repetitive price patterns, which offers traders an opportunity to understand the chart dynamics on a deeper level. It also allows traders to spot interesting areas and price zones on the chart where trades have a higher probability of success.
Free Reports:
 Get Our Free Metatrader 4 Indicators - Put Our Free MetaTrader 4 Custom Indicators on your charts when you join our Weekly Newsletter
 Get our Weekly Commitment of Traders Reports - See where the biggest traders (Hedge Funds and Commercial Hedgers) are positioned in the futures markets on a weekly basis.
The first step in understanding
wave patterns is to understand the two patterns below:
- impulse and correction
- chart patterns
Let’s use practical chart examples to illustrate the importance of impulse, correction, and chart patterns, which determine the rhythm of the chart. This EUR/USD 1-hour chart, for instance, shows bearish impulsive price action (red arrows) and choppy bullish corrections (green arrow).

Image: EUR/USD 1-Hour Chart from 27 September to 11 October 2017
Eventually, the bearish price action loses its steam and momentum, and the price starts showing a falling wedge reversal chart pattern (orange lines). The bullish breakout (blue arrows) indicates the end of an old bearish swing and the start of a new bullish one.
We can use that information to label these swings on higher time frames. We can zoom out to the higher time frame of the 4-hour chart, where we see this:
- The bullish break (blue arrow) above the falling wedge (orange lines) indicates the completion of a larger bearish corrective swing.
- In this case, the best estimate at this time is that 5 bearish waves (orange) completed a larger ABC (purple) pattern at the -61.8% Fibonacci target.

Image: EUR/USD 4-Hour Chart from 23 August to 16 October 2017
Analysing Wave Patterns With Confidence
One of the most important steps in analysing wave patterns with (more) confidence is by implementing these two concepts:
- Consistent approach for identifying a price swing;
- Confirmation and invalidation levels for wave analysis.
I believe that many traders are hesitant with their
wave analysis because they lack an internal system for understanding when one price swing has most likely ended and a new one has started.
My approach is based on the Awesome Oscillator, moving averages, and
trend lines. It goes beyond the scope of this article to explain the details, which is why I added a video below.
The second key ingredient is to work with confirmation and invalidation levels. Wave analysis will never be an exact science. Wave analysts can only work with the most likely scenarios, nothing is 100% certain.
Wave analysts, however, can establish levels which either confirm or invalidate their outlook. If there is a confirmation, then traders can monitor the charts for potential setups (read on to the next part) and if there is an invalidation, then they can re-analyse the charts to understand the new outlook.
Here is an example of both a confirmation and an invalidation scenario. The bullish breakout above the same falling wedge
chart pattern (orange lines) mentioned in the previous section confirmed a bullish reversal. These were my new invalidation and confirmation levels for the next two spots on the charts:
- At spot 1 indicated by the green one (1), I am expecting a bullish continuation within a wave 3 or wave C towards resistance around 1.1875-1.19.:
- Confirmation is a break above the bull flag (purple lines).
- Invalidation is a break below the flag and the 1.1750 round level.
- The price confirmed my bullish outlook by breaking above the flag and hitting the target.
- At spot 2 indicated by the purple two (2), I am slightly leaning towards a bullish continuation within a wave 4-5 pattern towards 1.1950-1.20:
- Confirmation is a bullish break above the correction (red lines) with a break, pullback, and continuation (purple lines).
- Invalidation is a break below the 50%-61.8% Fibonacci support levels. It’s not technically a full invalidation, but it makes the outlook unlikely (a full invalidation occurs when the price hits the range of wave 1).
- The price broke below the 50% Fibonacci level and made a larger bearish move (dark red arrows).
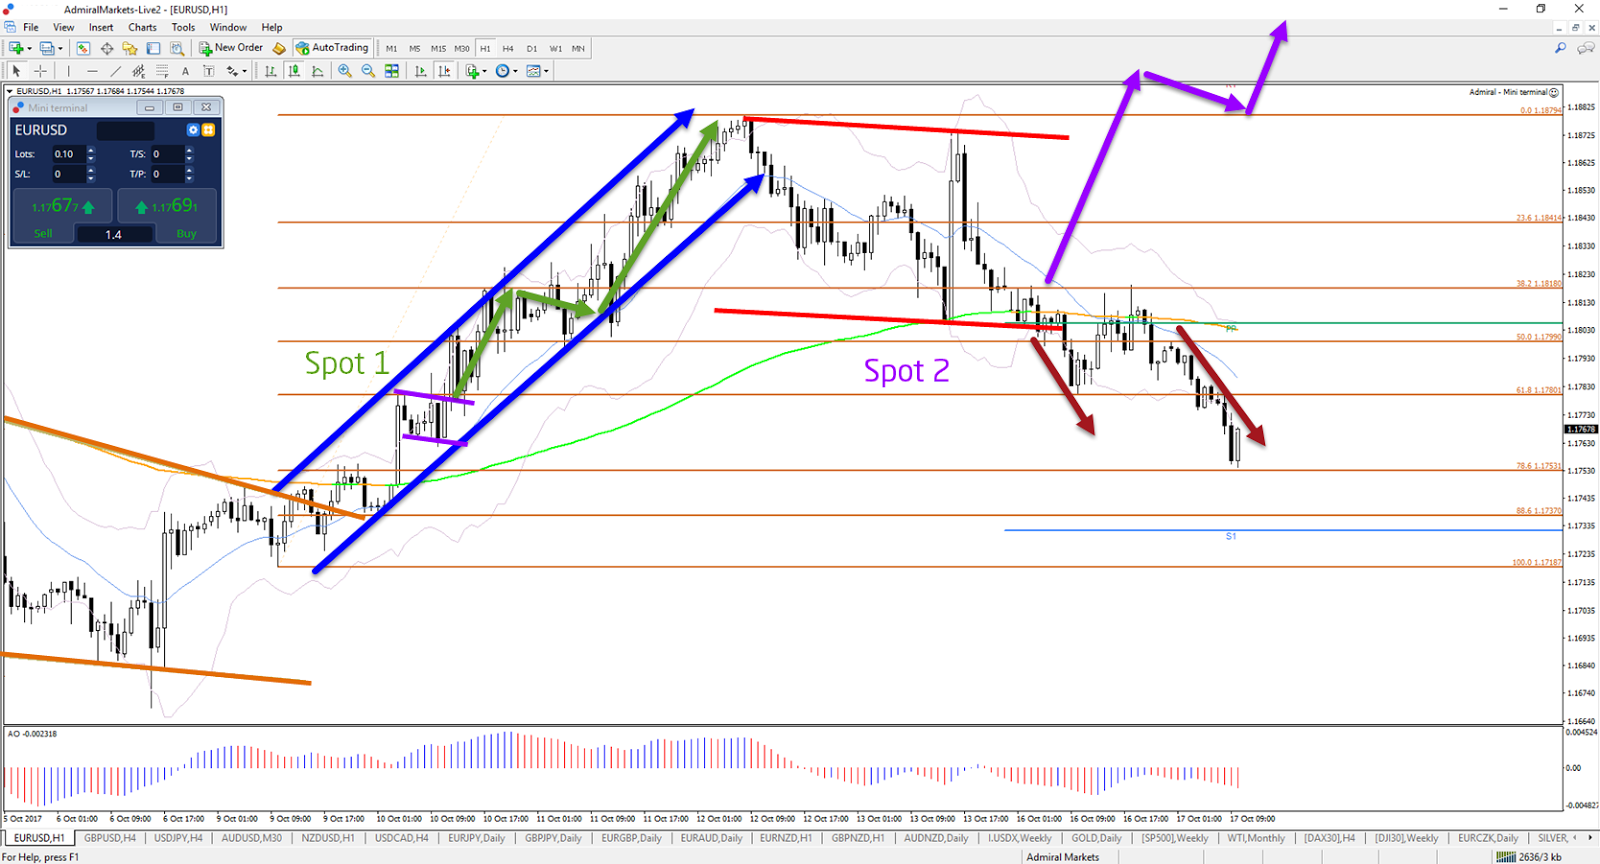
Image: EUR/USD 1 hour chart from 5 October to 17 October 2017
Translating Wave Analysis into Setups
The last but crucial step is how to translate wave analysis into actual trade setups. The most important aspect is to understand that wave analysis is best used for:
- Determining the trend direction.
- Seeing the bigger picture and potential on higher time frames.
- Providing a heads-up what the price could do at Support & Resistance.
Its strength is not focussed on basing entries only on wave analysis, although this is possible and many wave traders do so. I prefer, however, to use it as support for my decisions, and as a tool of confluence.
Also, be aware that using wave analysis is easier to analyse and read in situations where the price is making clear impulsive movement rather than large, expanded, and choppy corrections. In the latter case, you want to be on guard and not rely on your wave outlook too strongly.
As a final note, I want to confirm that my main entry tool is based on price action, candlesticks, and candlestick patterns. Wave patterns and chart analysis provide a detailed outlook of a) what to potentially expect and b) zones of interest to monitor. The actual signal for entries, however, is best when based on price action.
For more
daily wave analysis, please check out my wave analysis section with Admiral Markets.
Cheers and safe trading,
Chris Svorcik
Follow
@ChrisSvorcik on Twitter for the latest market updates!
Connect with
Chris Svorcik on Facebook for more Forex and CFD analysis!

Article by Admiral Markets
Source: How to Build Confidence in Your Wave Analysis and Trade Setups

Admiral Markets is a leading online provider, offering trading with Forex and CFDs on stocks, indices, precious metals and energy.