Article By RoboForex.com
EUR USD, “Euro vs US Dollar”
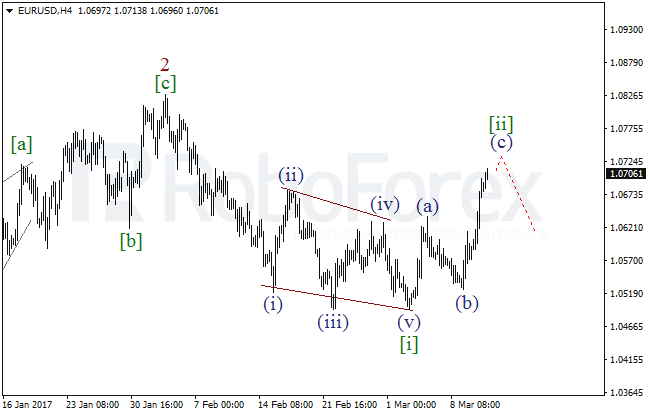
It looks like the EUR/USD pair is about to complete the wave [ii], which is taking the form of the zigzag. Later, after finishing the wave (c), the market may resume falling.
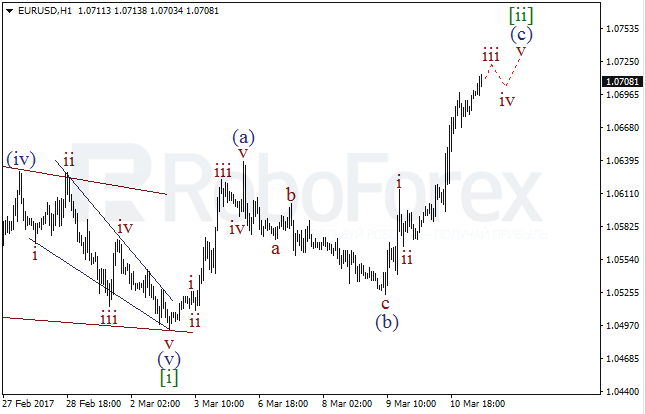
More detailed structure is shown on the H1 chart. After finishing the zigzag in the eave (b), the pair started forming the ascending impulse in the wave (c) of [ii]. On Monday, the price may continue growing, but after completing the wave v of (c), the market is expected to resume moving downwards.
GBP USD, “Great Britain Pound vs US Dollar”
After finishing the horizontal triangle in the wave (iv), the GBP/USD pair completed the descending impulse in the wave i. Consequently, after finishing the local correction, the market may start another decline in the wave iii of (v).
Free Reports:
 Get Our Free Metatrader 4 Indicators - Put Our Free MetaTrader 4 Custom Indicators on your charts when you join our Weekly Newsletter
 Get our Weekly Commitment of Traders Reports - See where the biggest traders (Hedge Funds and Commercial Hedgers) are positioned in the futures markets on a weekly basis.

As we can see at the H1 chart, last Friday completed the wave [5] of i and started an ascending correction. As a result, during the day the market may continue growing in the wave ii of (v).

USD JPY, “US Dollar vs Japanese Yen”
Possibly, the USD/JPY pair is extending the wave (iii) of [iii]. Earlier, the price completed the bullish impulse in the wave (i) and the correctional wave [ii] in the form of the zigzag. Consequently, in the nearest future the market may resume growing and break the local high.

More detailed structure is shown on the H1 chart. Probably, the pair is completing the zigzag in the wave ii. It’s highly likely that in the nearest future the market may resume moving upwards while forming the wave iii of (iii).

AUD USD, “Australian Dollar vs US Dollar”
After finishing the zigzag in the wave [e] of 4, the AUD/USD pair completed the descending impulse in the wave (i). Consequently, after finishing the wave (ii), the price may start a new bearish impulse in the wave (iii).

As we can see at the H1 chart, the pair completed the wave v of (i) and right now is being corrected to the upside. Possibly, the wave (ii) may take the form of the zigzag. If this assumption is correct, then after finishing the local correction, the pair start a short-term growth in the wave c of (ii).

RoboForex Analytical Department
Article By RoboForex.com
Attention!
Forecasts presented in this section only reflect the author’s private opinion and should not be considered as guidance for trading. RoboForex LP bears no responsibility for trading results based on trading recommendations described in these analytical reviews.