By Money Metals News Service
It can be difficult, even for dyed-in-the-wool perma-bulls to hold onto precious metals, let alone buy more. We see the Dow trading above 20,000 (placing this into perspective, is that since 2000, the Dow is up around 65% versus gold’s 300%), gold and silver currently languishing below multiple “resistance” points; suspended just above a couple of “support” lines. For long-suffering holders, it feels like the fabled Sword of Damocles dangling over their head, suspended by that proverbial single strand of hair.
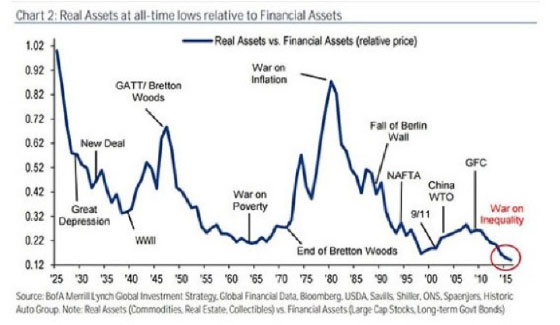
If you fit the above description, the following chart should provide good cheer. You’ll notice that since 1925, a few years before the Great Depression, up until the current day, financial assets (paper) – bonds, large cap stocks, and derivatives – have never been more overvalued in relation to metals and minerals, than they are now.

Financial (Paper) Assets vs. Real (Metals/Minerals)Assets (Courtesy Sources Listed)
What you must realize, is that if you truly desire to “insure” some of your own financial assets against a major turn of events with the potential to heavily damage their value, then it is imperative to seriously consider a position in the asset class which above all others, tends to move in direct opposition to them.
The “kicker” is that, at such undervalued rates, when – not if- the metals return to the norm, that movement, plus the almost inevitable overshoot, makes it close to a lead pipe cinch that you’ll be looking at a big profit on your purchase as well. The metaphorical rubber band stretches just so far, then reverses. And that class has at its apex, gold and silver.
It’s not just an article of faith, but rather a proven fact that the more out of favor a category is, the less downside risk and the greater upside appreciation potential there will be. Markets move up on sustained buying – in the earliest stages rising on a so-called “wall of worry” – wherein in spite of all the naysayers’ protestations, the price of the item in question continues to move higher. Later as the trend matures, you’ll see stronger upward movement with less and less objection from observers ,and more writers agreeing with the move. This signals that “more people are joining the parade”, with less watching. Finally, almost everyone is “all-in” with lines around the block as late-comers frantically try to buy what little remains of gold and silver in retail hands – but we are far from that situation today. Sure it’s “easy” to buy the Dow above 20,000, and as it rises on reduced volume, large numbers of IRA investors are doing just that. But big money is seldom made this way.
Free Reports:
 Get Our Free Metatrader 4 Indicators - Put Our Free MetaTrader 4 Custom Indicators on your charts when you join our Weekly Newsletter
 Get our Weekly Commitment of Traders Reports - See where the biggest traders (Hedge Funds and Commercial Hedgers) are positioned in the futures markets on a weekly basis.
The five categories of a gold miner’s ore body
Whether in production, or on a path toward it, a mining company needs to determine via expensive drilling, magnetic testing, laboratory sampling and computer modeling programs, how much gold-bearing ore they have, and how likely what they possess – or think they hold – can be produced at a profit. The most well-known of formal reporting methods is the Canadian resource classification reporting methodology called the (National Instrument) NI 43- 101 Report.
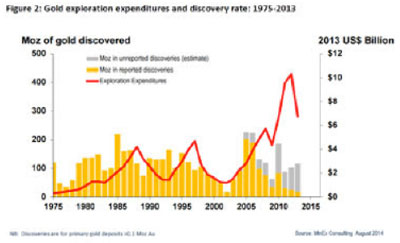
The two categories – and within them, five sub-categories, in order of descending likelihood of being recovered and sold at a profit are: Reserves: Proven and Probable; Resources: Measured, Indicated, and Inferred. A company will not generally undertake to build a mine/mill unless they have identified reserves that should grant them a 7-10 year production life. Resources sound great, but they may or may not ever “pan out”. The following chart shows that for the past 7 years, even as exploration expenditures increased, success in locating gold in “unreported discoveries” languished. In the millions of ounces (Moz) “reported category” – the amount has cratered.

Less than a year ago, industry CEOs were talking about world gold production peaking “sometime during the next 10 years.” Now we’re seeing that Reserves – the most accurate estimate of economically-recoverable gold, have declined 40% since 2011, and stand at levels not much higher than was the case in 2005, when the gold price was moving into the first solid phase of its long-term advance. A recent Bloomberg chart shows that recoverable (newly-discovered) gold has dropped fully 85% since 2006!
Keep in mind that a gold mine is a “wasting asset.” Every ounce produced that is not replaced by discovery of another economically-profitable ounce, takes the operation one step closer to the end of its productive life. Looking again at the discovery and expenditure chart demonstrates that as things now stand, the drop in Reserves – ounces most likely to be recovered at a profit – is taking place at warp speed. The much less-reliable Resources category – has also fallen sharply. Indeed, Indicated/Inferred figures themselves often end up being little more than hope and hype. And you can’t “take that to the bank.”

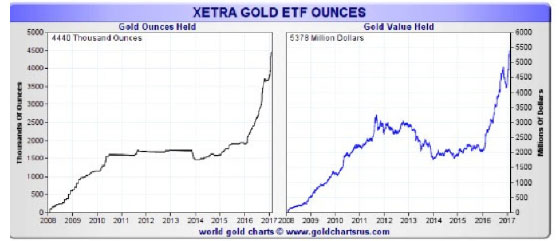
The European trading venue Xetra (Deutsche Börse AG)
In Europe, one week made a huge difference in gold demand
Recently, during one week, the European trading venue, Xetra Gold ETF (Deutsche Börse AG) saw an inflow in excess of one-half billion dollars, the largest such movement in 5 years! This amount was 10 times more than GLD, the U.S. ETF equivalent registered during that same week. Other European metals’ ETFs saw increased activity as well.
In this space a year ago, I discussed Rich Dad Robert Kiyosaki’s way of looking at things, using his analogy of a gold coin. Whereas most people see just the front (obverse) and back (reverse), Kiyosaki sees a third side – the edge. Only by looking at an issue from the vantage point of the edge, will you be able to “see both sides of the coin”.
Mr. Market alone can predict the future, but viewing the concept of gold and silver ownership from the edge brings great clarity as to what’s going on and how you might respond. This year is shaping up to be a replay of 2016, with the metals possibly being even stronger to mining stocks on a relative basis than was the case last year. My perspective from the edge, is that the time to take action and claim your physical precious metals stake is growing short. I can’t tell you exactly when “it’s too late” is going to be, but whenever that inflection moment comes, the window of opportunity we now have is going to be visible only in the rear view mirror.
David Morgan at The Morgan Report puts it short and sweet. Be Real. Get Real. Buy Real. So “get on the edge.” Check out the view… and then do something about it.
 The Money Metals News Service provides market news and crisp commentary for investors following the precious metals markets.