by JustForex
BTCUSD, “Bitcoin vs US Dollar”
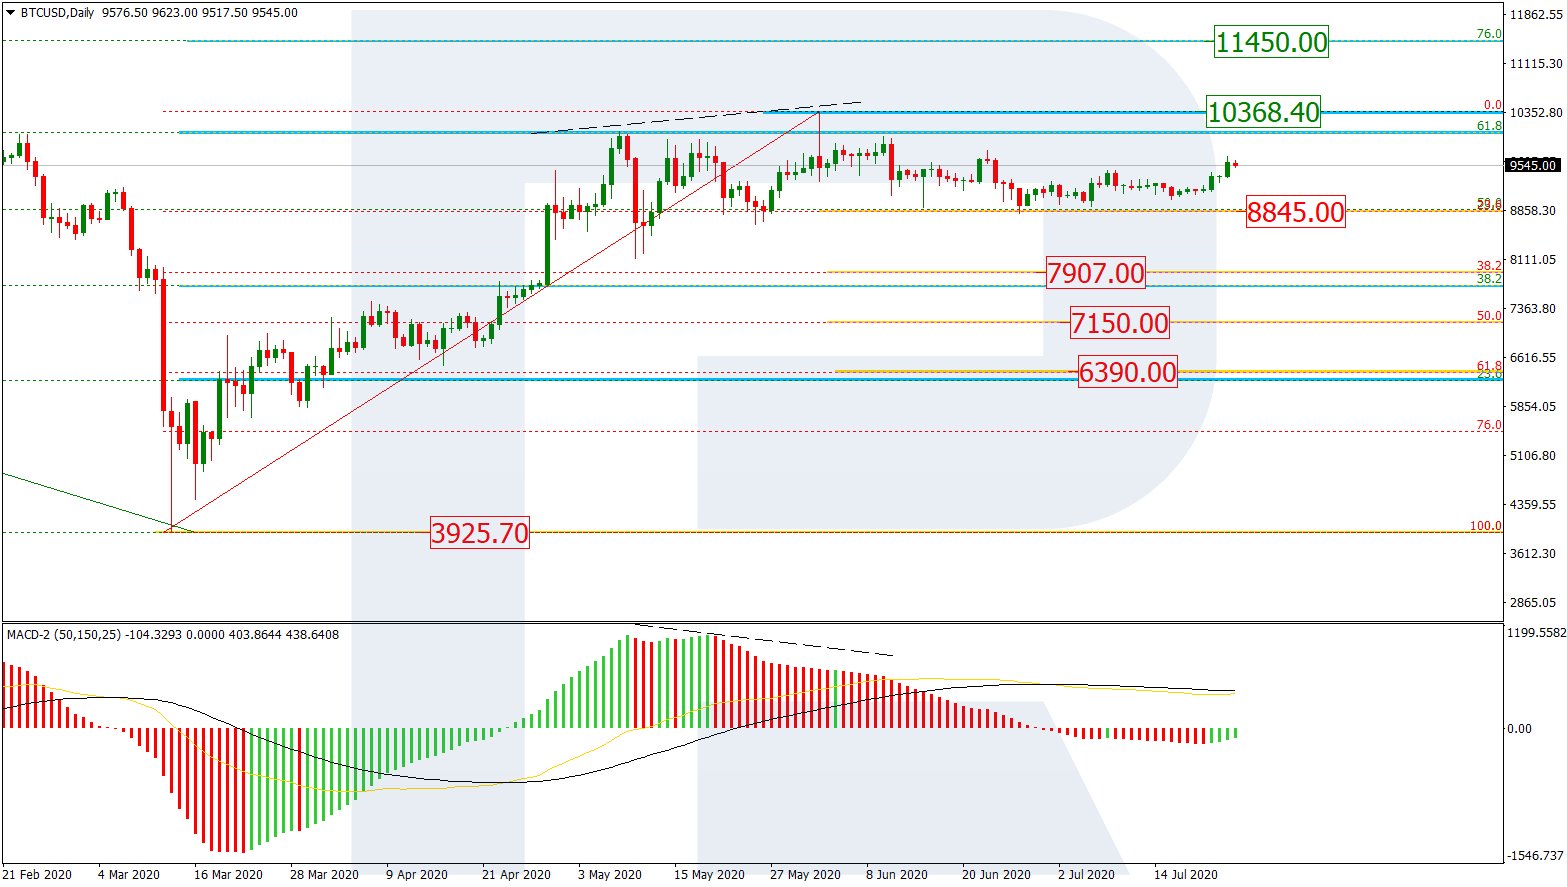
As we can see in the daily chart, after testing the current support at 23.6% fibo (8845.00), BTCUSD is forming a steady ascending structure, which may be considered as a new wave towards the high at 10368.40. If the breaks the high, it may continue growing to reach the long0term 76.0% fibo at 11450.00. However, as long as the high isn’t broken, the asset may resume falling towards 38.2%, 50.0%, and 61.8% fibo at 7907.00, 7150.00, and 6390.00 respectively.


The H4 chart a new rising impulse after the convergence, which has already reached 50.0% fibo and may continue towards 61.8% and 76.0% fibo at 9775.00 and 9995.00 respectively. however, in the nearest future. The key support is the low at 8814.20.


ETHUSD, “Ethereum vs. US Dollar”
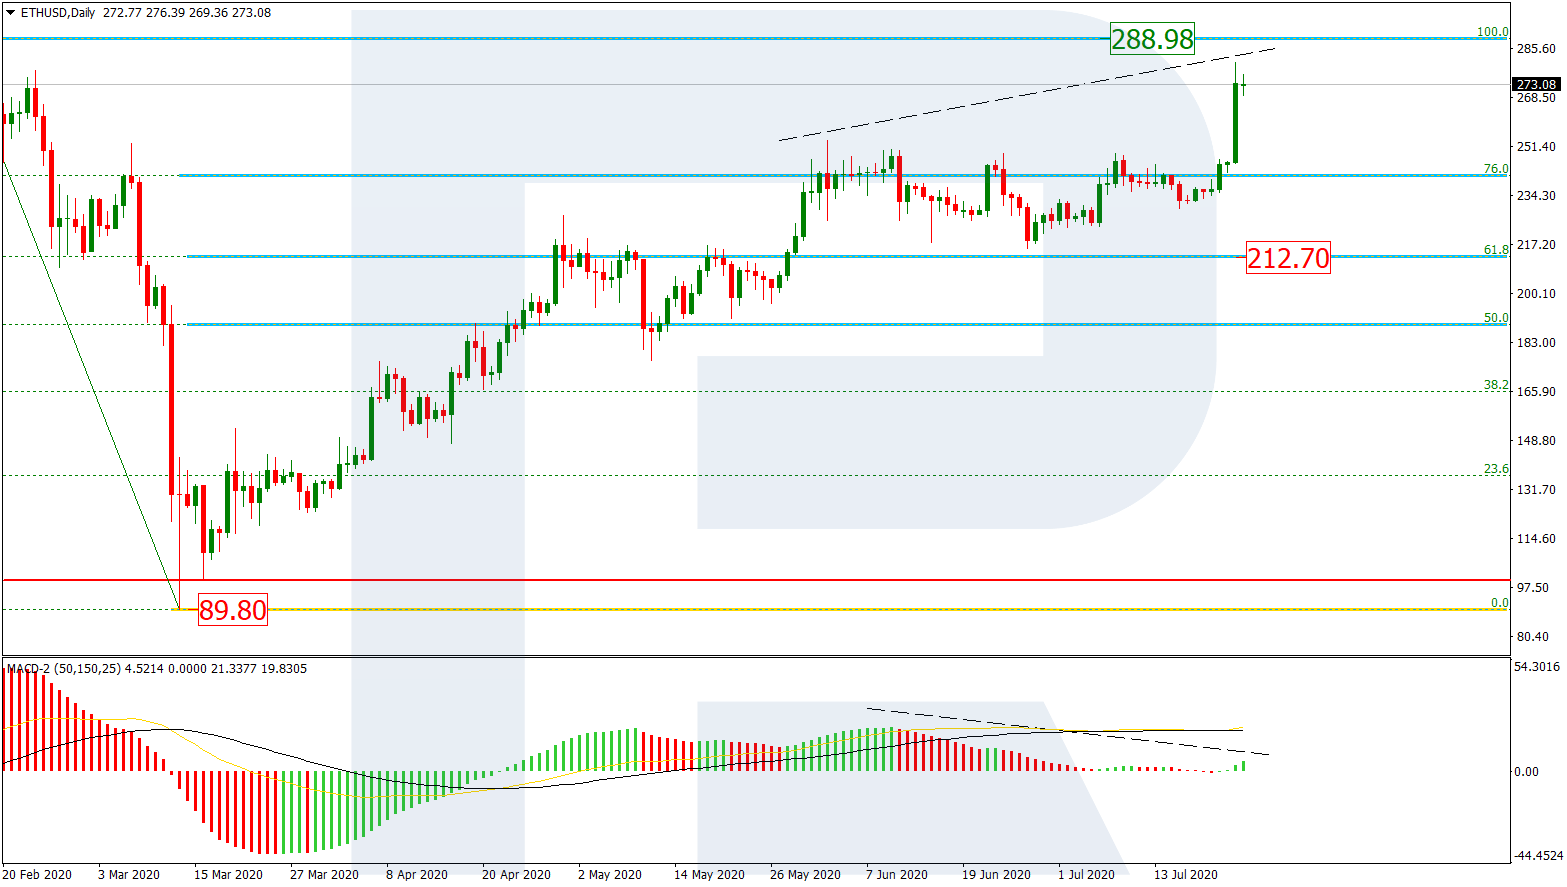
As we can see in the H4 chart, after finishing the sideways correction around 76.0% fibo, Ethereum started a new rising impulse, which has already broken the high, and right now is trading towards the key high at 288.98. At the same time, there might be a divergence on MACD, which may indicate a possible pullback after the instrument reaches the target. The correctional target is the support at 61.80% fibo at 212.70.
Free Reports:
 Get Our Free Metatrader 4 Indicators - Put Our Free MetaTrader 4 Custom Indicators on your charts when you join our Weekly Newsletter
 Get our Weekly Commitment of Traders Reports - See where the biggest traders (Hedge Funds and Commercial Hedgers) are positioned in the futures markets on a weekly basis.


In the H4 chart, the convergence made the pair complete the correctional downtrend and start a new growth, which, after breaking the high at 253.47, has entered the post-correctional extension area between 138.2% and 161.8% fibo at 267.78 and 276.98 respectively. Possibly, the pair may trade sideways within this range. The key support is the low at 215.90.

by JustForex