By Orbex
Recent developments saw the Fed slashing rates further while pledging to increase its bond holdings by $700 billion.
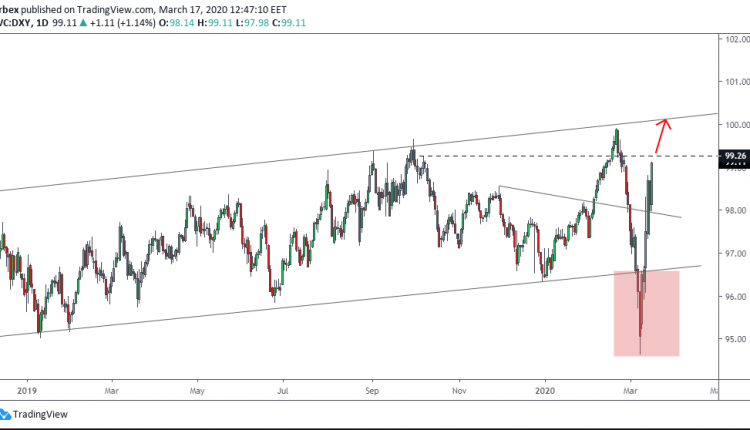
The King Dollar fell at the start of the recent financial turmoil. After peaking up to just shy off the triple-digit mark, it nosedived to 95.30 in two weeks of trading.
It ended up forming a bottom and started a surge that turned into a massive rally since then.
Technically, the above chart shows an ascending channel with the bottom residing on March 11 low of 96.60. The top extended slightly higher to the 100.00 round level.
We end up witnessing a false break under the base of the channel on the daily chart (see highlighted area); and we are tracking (96.60).
Free Reports:
 Get Our Free Metatrader 4 Indicators - Put Our Free MetaTrader 4 Custom Indicators on your charts when you join our Weekly Newsletter
 Get our Weekly Commitment of Traders Reports - See where the biggest traders (Hedge Funds and Commercial Hedgers) are positioned in the futures markets on a weekly basis.
As seen on the 8H chart below, price managed to pull back furiously and headed the march higher.

With the daily close above the 98.00 handle, the index is poised to carry on towards the 100.00 mark and slightly higher.
The next resistance of importance comes at 99.25. A meaningful close above would place the 100.00 level mark at a striking distance.
Notice the trend line emphasizing the 99.25-30 region.
By Orbex