USD/JPY at the mercy of the US-Chinese trade dispute


Source: Economic Events October 11, 2019 – Admiral Markets’ Forex Calendar
With the US Trade Talks to finish today, we want to take a look at the USD/JPY.
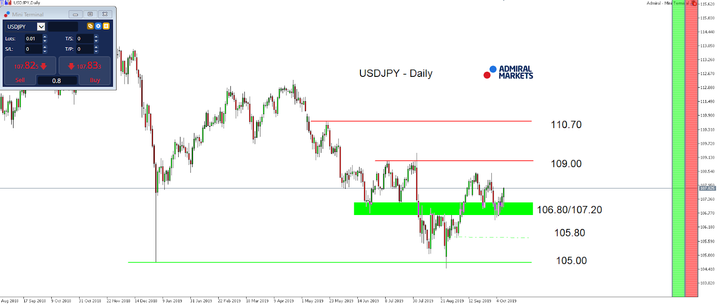
After tensions in the trade dispute between the US and China heated up again in the first half of this week, after news broke that the White House continues to consider capital control like limiting Chinese stocks in the US Government Fund or similar, the USD/JPY attacked the region around 106.80/107.00, but didn’t break lower, but instead stabilised over the last days.
Nevertheless, when looking at the daily chart, we feel vindicated in an overall bearish outlook for the currency pair, at least as long as the USDJPY trades below 108.50/109.00.
And even if we get to hear any positive signs of at least a partial trade deal with the US and China negotiating topics like intellectual property or Government subsidies in the upcoming months respectively in 2020, a rather sooner than later attempt to break below 106.80/107.00 in the days to come remains a serious option.
Free Reports:


A big driver here could be from the comments made by Fed chairman last Tuesday at a speech in Denver, where Powell said that the FED will resume Asset Purchases to prevent a cash crunch and bringing QE4 officially on the table (even though (surprisingly) emphasizing that it is not a QE).
With that in mind, we consider another attempt to break back below 106.80/107.00 with a significant higher probability than USDJPY trying to break back above 108.50/109.00.
This is still and especially true if any signs of risk aversion start to materialise where a next wave of selling could result in USDJPY being pushed below 105.80 and trigger further selling, quickly activating the region around 105.00 again:


Source: Admiral Markets MT5 with MT5-SE Add-on USD/JPY Daily chart (between August 24, 2018, to October 10, 2019). Accessed: October 10, 2019, at 10:00pm GMTPlease note: Past performance is not a reliable indicator of future results, or future performance.
In 2014, the value of the USD/JPY increased by 13.7%, in 2015, it increased by 0.5%, in 2016, it fell by 2.8%, in 2017, it fell by 3.6%, in 2018, it fell by 2.7%, meaning that after five years, it was up by 4.1%.
Discover the world’s #1 multi-asset platform
Admiral Markets offers professional traders the ability to trade with a custom, upgraded version of MetaTrader 5, allowing you to experience trading at a significantly higher, more rewarding level. Experience benefits such as the addition of the Market Heat Map, so you can compare various currency pairs to see which ones might be lucrative investments, access real-time trading data, and so much more. Click the banner below to start your FREE download of MT5 Supreme Edition!
Disclaimer: The given data provides additional information regarding all analysis, estimates, prognosis, forecasts or other similar assessments or information (hereinafter “Analysis”) published on the website of Admiral Markets. Before making any investment decisions please pay close attention to the following:
- This is a marketing communication. The analysis is published for informative purposes only and are in no way to be construed as investment advice or recommendation. It has not been prepared in accordance with legal requirements designed to promote the independence of investment research, and that it is not subject to any prohibition on dealing ahead of the dissemination of investment research.
- Any investment decision is made by each client alone whereas Admiral Markets shall not be responsible for any loss or damage arising from any such decision, whether or not based on the Analysis.
- Each of the Analysis is prepared by an independent analyst (Jens Klatt, Professional Trader and Analyst, hereinafter “Author”) based on the Author’s personal estimations.
- To ensure that the interests of the clients would be protected and objectivity of the Analysis would not be damaged Admiral Markets has established relevant internal procedures for prevention and management of conflicts of interest.
- Whilst every reasonable effort is taken to ensure that all sources of the Analysis are reliable and that all information is presented, as much as possible, in an understandable, timely, precise and complete manner, Admiral Markets does not guarantee the accuracy or completeness of any information contained within the Analysis. The presented figures refer that refer to any past performance is not a reliable indicator of future results.
- The contents of the Analysis should not be construed as an express or implied promise, guarantee or implication by Admiral Markets that the client shall profit from the strategies therein or that losses in connection therewith may or shall be limited.
- Any kind of previous or modeled performance of financial instruments indicated within the Publication should not be construed as an express or implied promise, guarantee or implication by Admiral Markets for any future performance. The value of the financial instrument may both increase and decrease and the preservation of the asset value is not guaranteed.
- The projections included in the Analysis may be subject to additional fees, taxes or other charges, depending on the subject of the Publication. The price list applicable to the services provided by Admiral Markets is publicly available from the website of Admiral Markets.
- Leveraged products (including contracts for difference) are speculative in nature and may result in losses or profit. Before you start trading, you should make sure that you understand all the risks.